Portfolio
This page lists several visualizations I have created. All of these work in the web browser. I was the sole frontend developer on these projects, though colleagues were involved in the backend parts of some of them.
Work at Imperial College London
Bicycle use in London
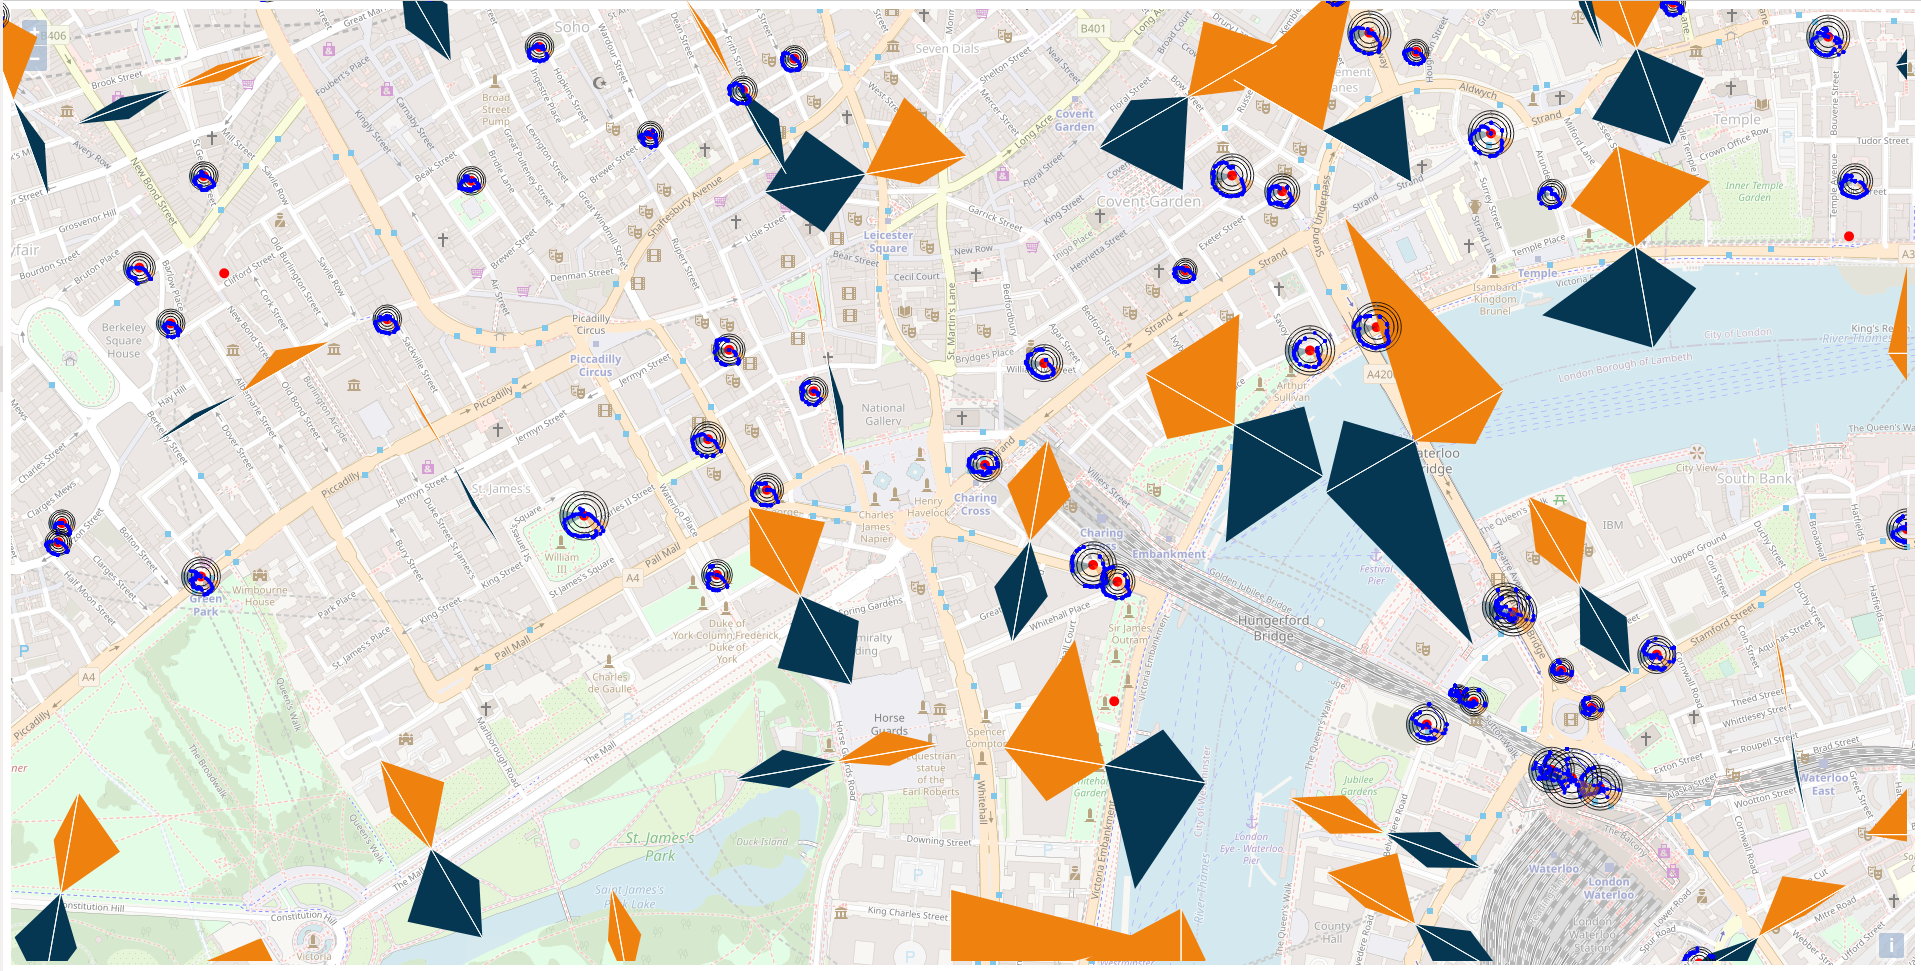
Intended audience: visitors to the Data Observatory display wall who were receiving a presentation about the potential of the space.
The arrows represent counts of bicycles travelling in each direction recorded during a traffic census; orange represents counts during the morning rush hour, and blue represents counts during the evening rush hour. The polar plots show the occupancy of bike-share stations throughout a typical day: angle encodes time, and radial position encodes the number of bicycles in the docking station.
Motivation: I created this interactive map as an example of how visualizations should be tailored to how they will be viewed. On a desktop- or mobile- sized screen it appears quite cluttered: it is much better suited to the 2m by 8m display for which it was designed. I aimed to show that in showing geographic data we usually have a tradeoff between showing geographic detail, and detailed data associated with location; for example, to show detailed time-series it might be necessary to switch from a geographic map to a more space-efficient squared cartogram. However, this constraint is much less important on a very large display surface such as a display wall.
Libraries used: Leaflet.js to display the map, d3.js
Winning entry into BioVis Challenge 2019
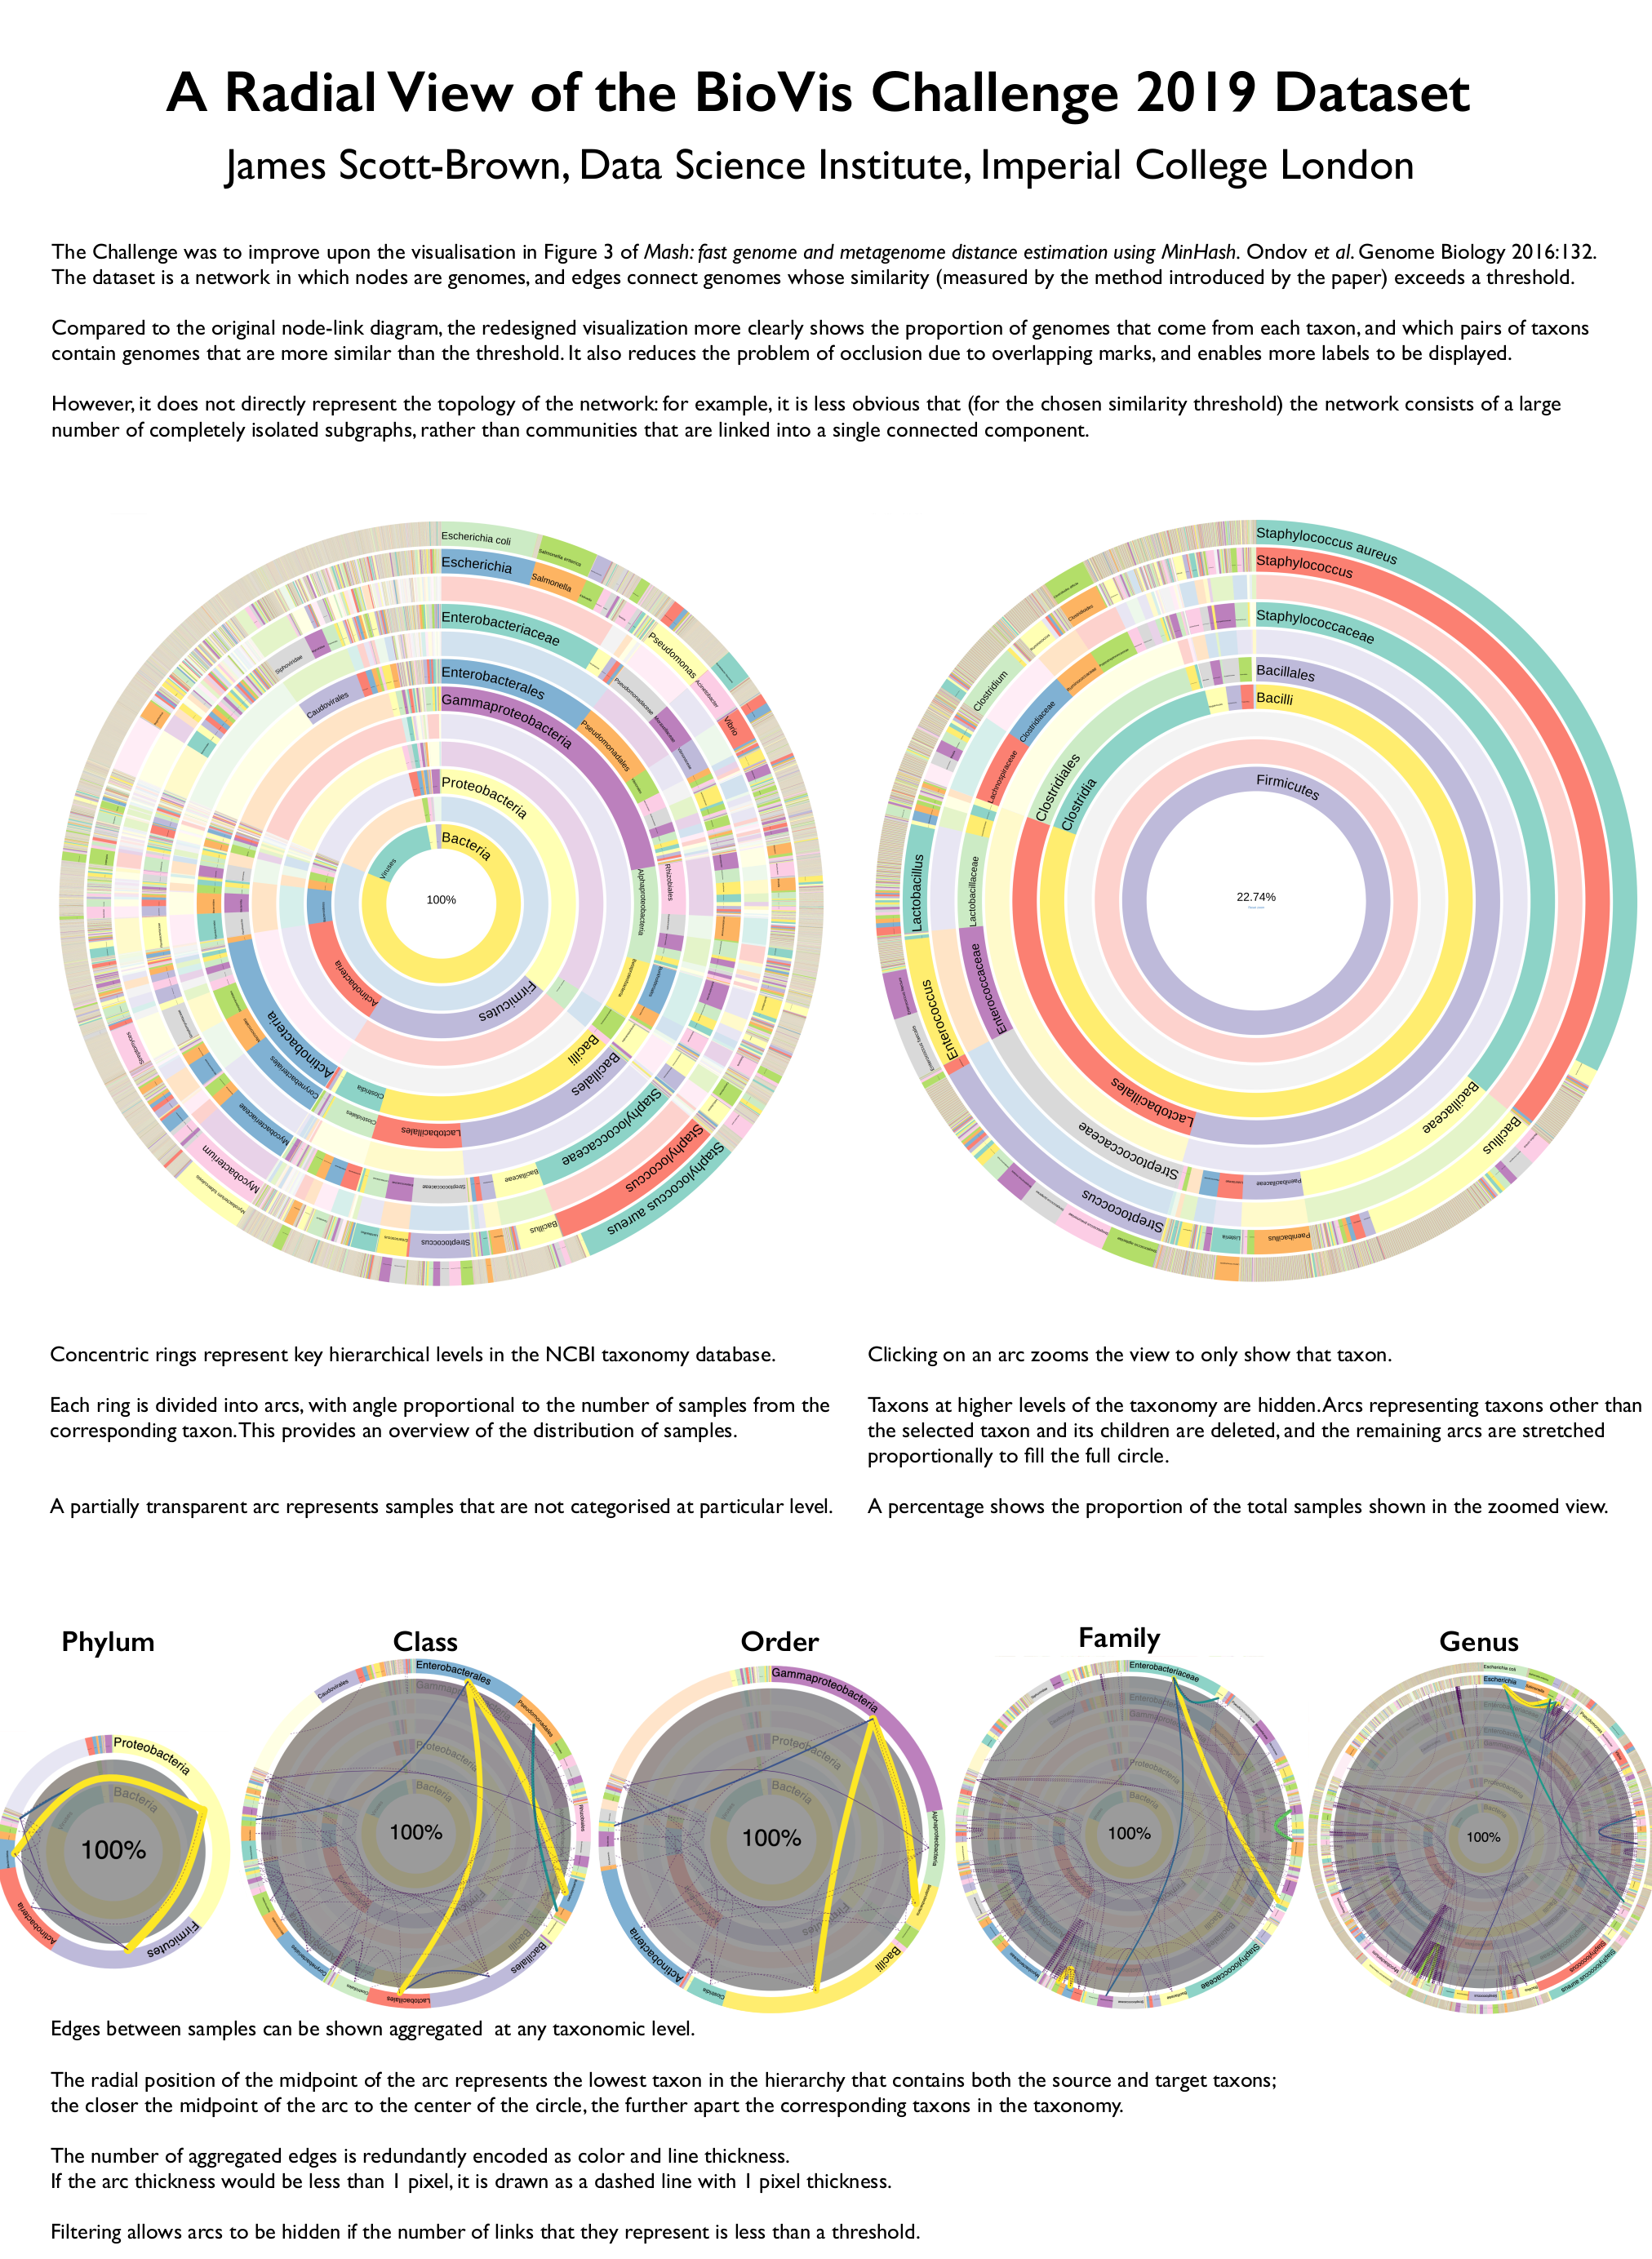
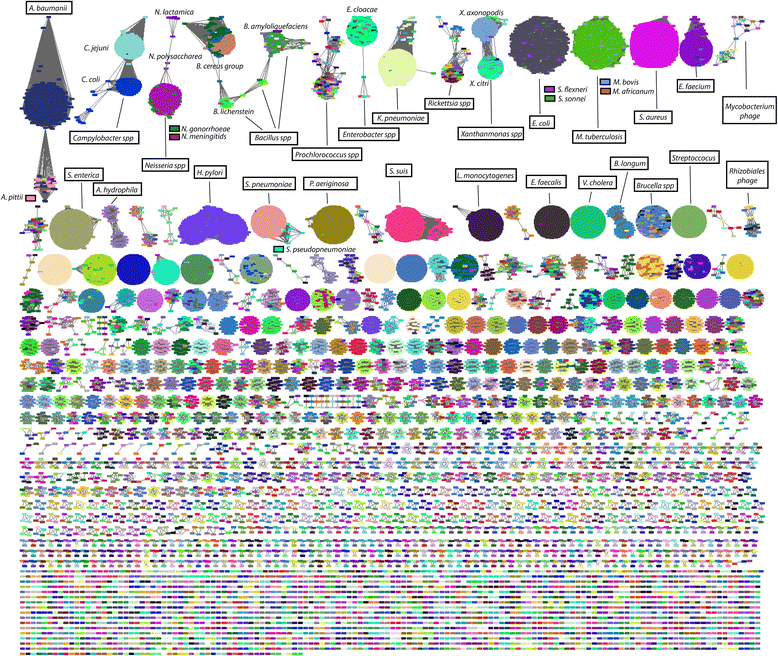
Motivation: the BioVis Challenge is an annual competition. In 2019, the task was to re-design a visualization of a large network from a previously published paper.
Data pre-processing: The provided network data listed links between taxonomic IDs. I wrote a Python script to load the full taxonomy (species, genus, family, order, class, phylum) for each of these from other publicly available data sources, and aggregated the edge data at several different levels.
Libraries used: D3.js.
Work at University of Oxford
Soft drink reformulations
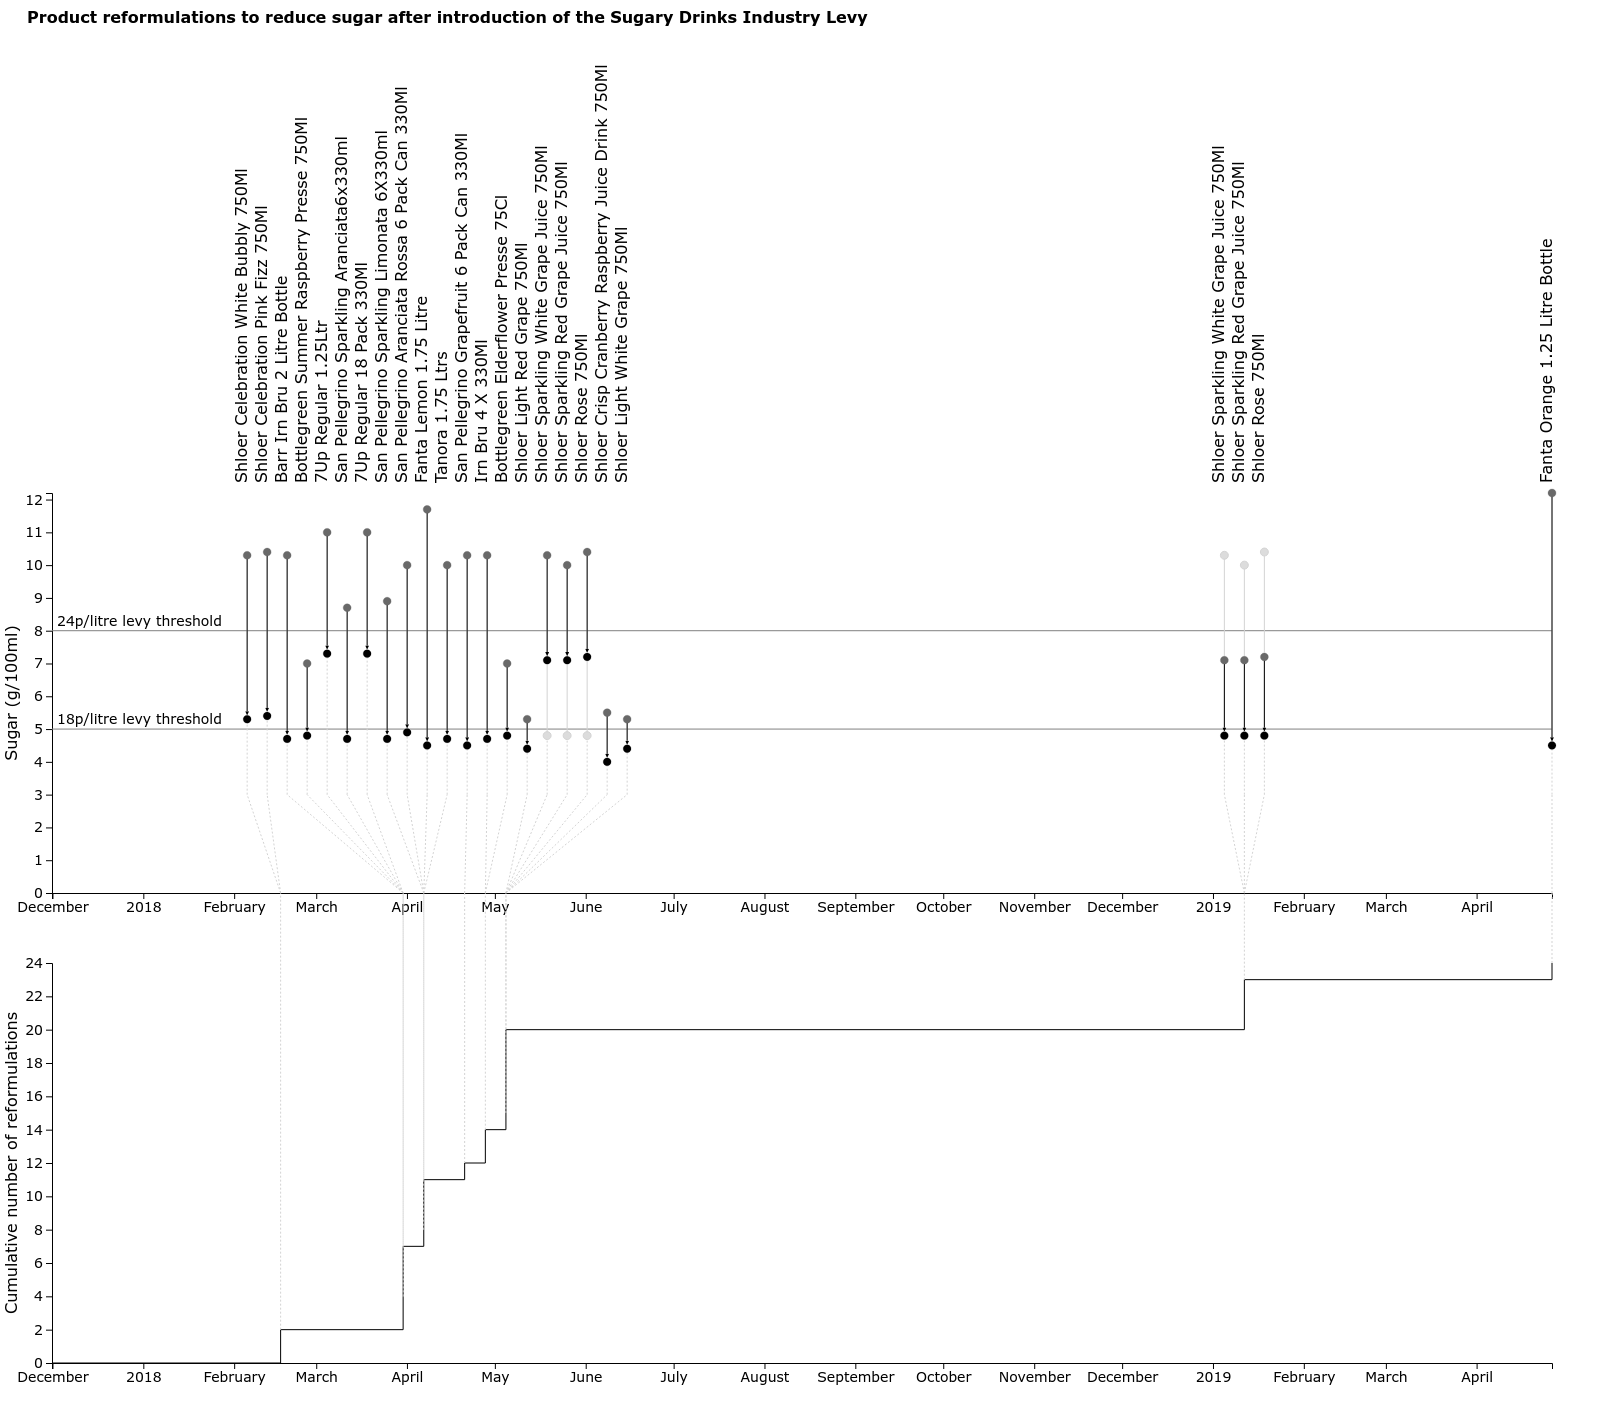
Motivation: The foodDB project has been scraping supermarkets to construct a longitudinal dataset about available foods, their prices, and their nutritional composition. In response to the introduction of the Soft Drinks Industry Levy, many sugary drinks were reformulated to reduce their sugar content. Some figures in previous publications by the group had shown the aggregate effect of these changes as histograms or stacked bar-charts, but I wanted a visualization that showed the individual changes.
Intended audience: this was intended to be a figure that could be used in presentations and publications to a scientific audience.
Data pre-processing: A Python script queries the foodDB database, and wrote a JSON file containing details of the price changes.
Libraries used: D3.js + respacer (a very small library I created that repositions objects to avoid overlaps)
Covid-related work for ISARIC4C
I produced several small calculators for the ISARIC4C consortium:- a calculator for the 4C Mortality and 4C Deterioration scores
- a calculator for both the 4C Mortality score only
- a calculator for clinical trial sizes
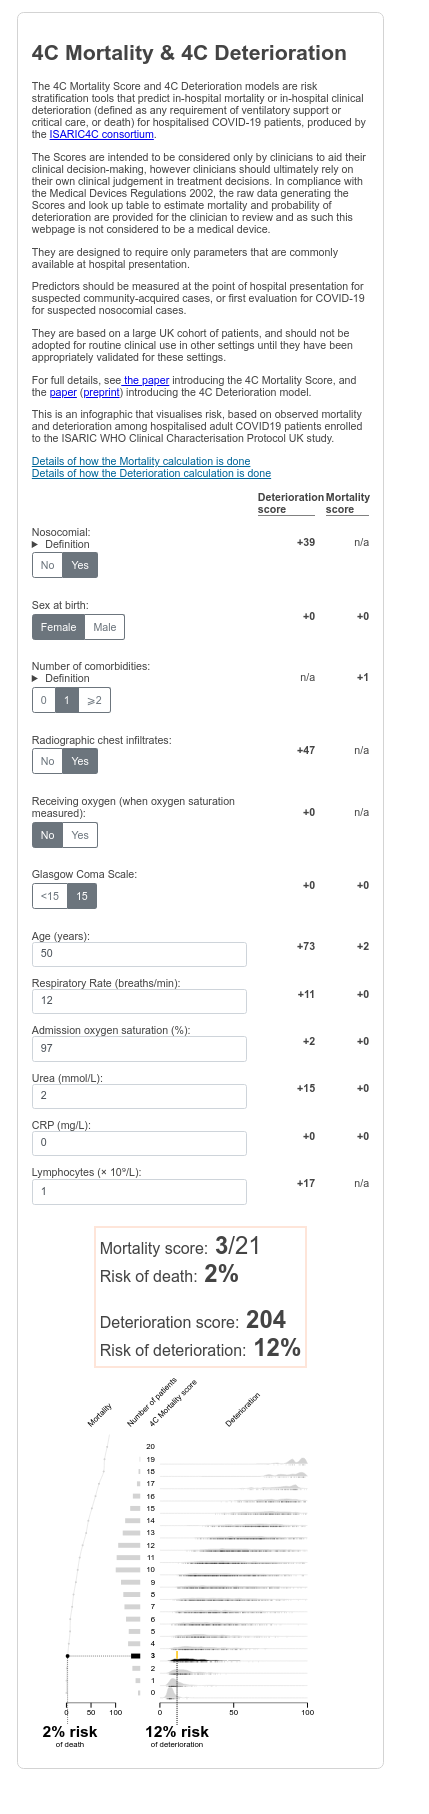
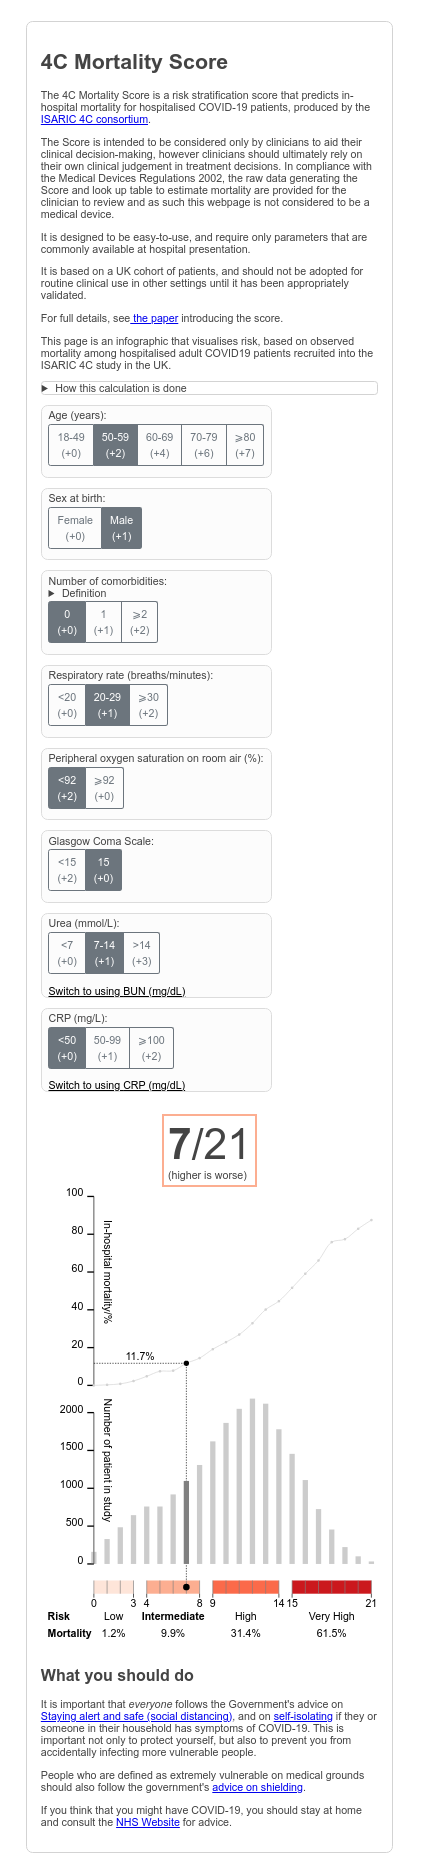
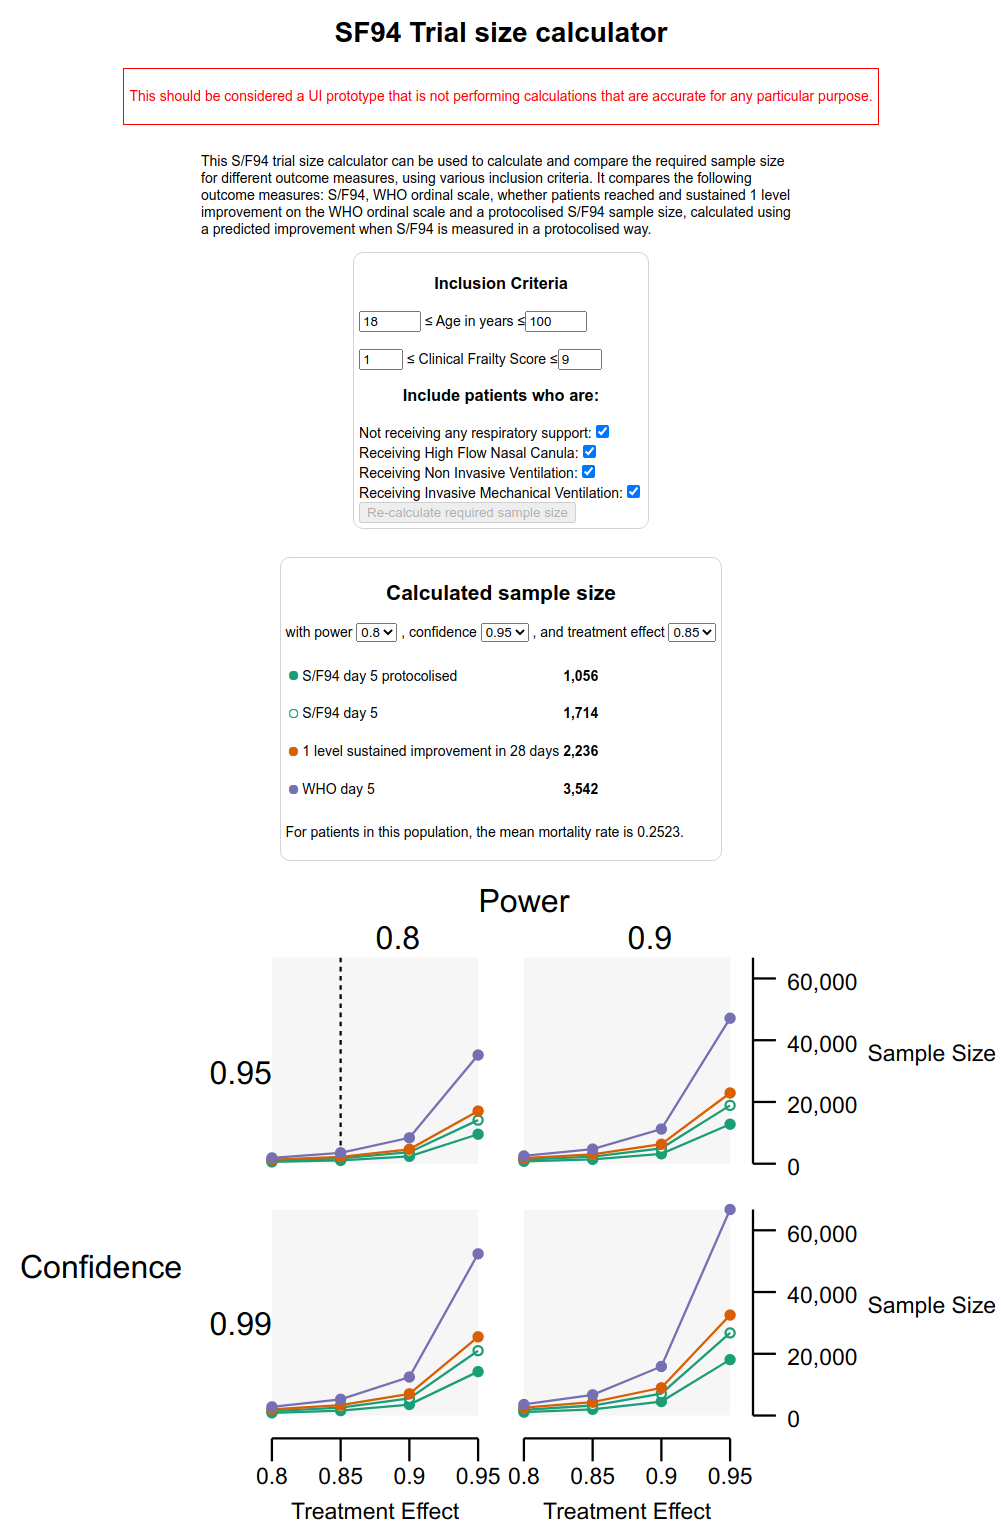
The score calculators perform calculations in the browser using JavaScript; the trial size calculations are performed by an R function written by a colleague, which was exposed through a web API using the plumber library.
Libraries used: D3.js and preact (an alternative implementation of the React API with a smaller bundle size)
Document collection browser (live site)
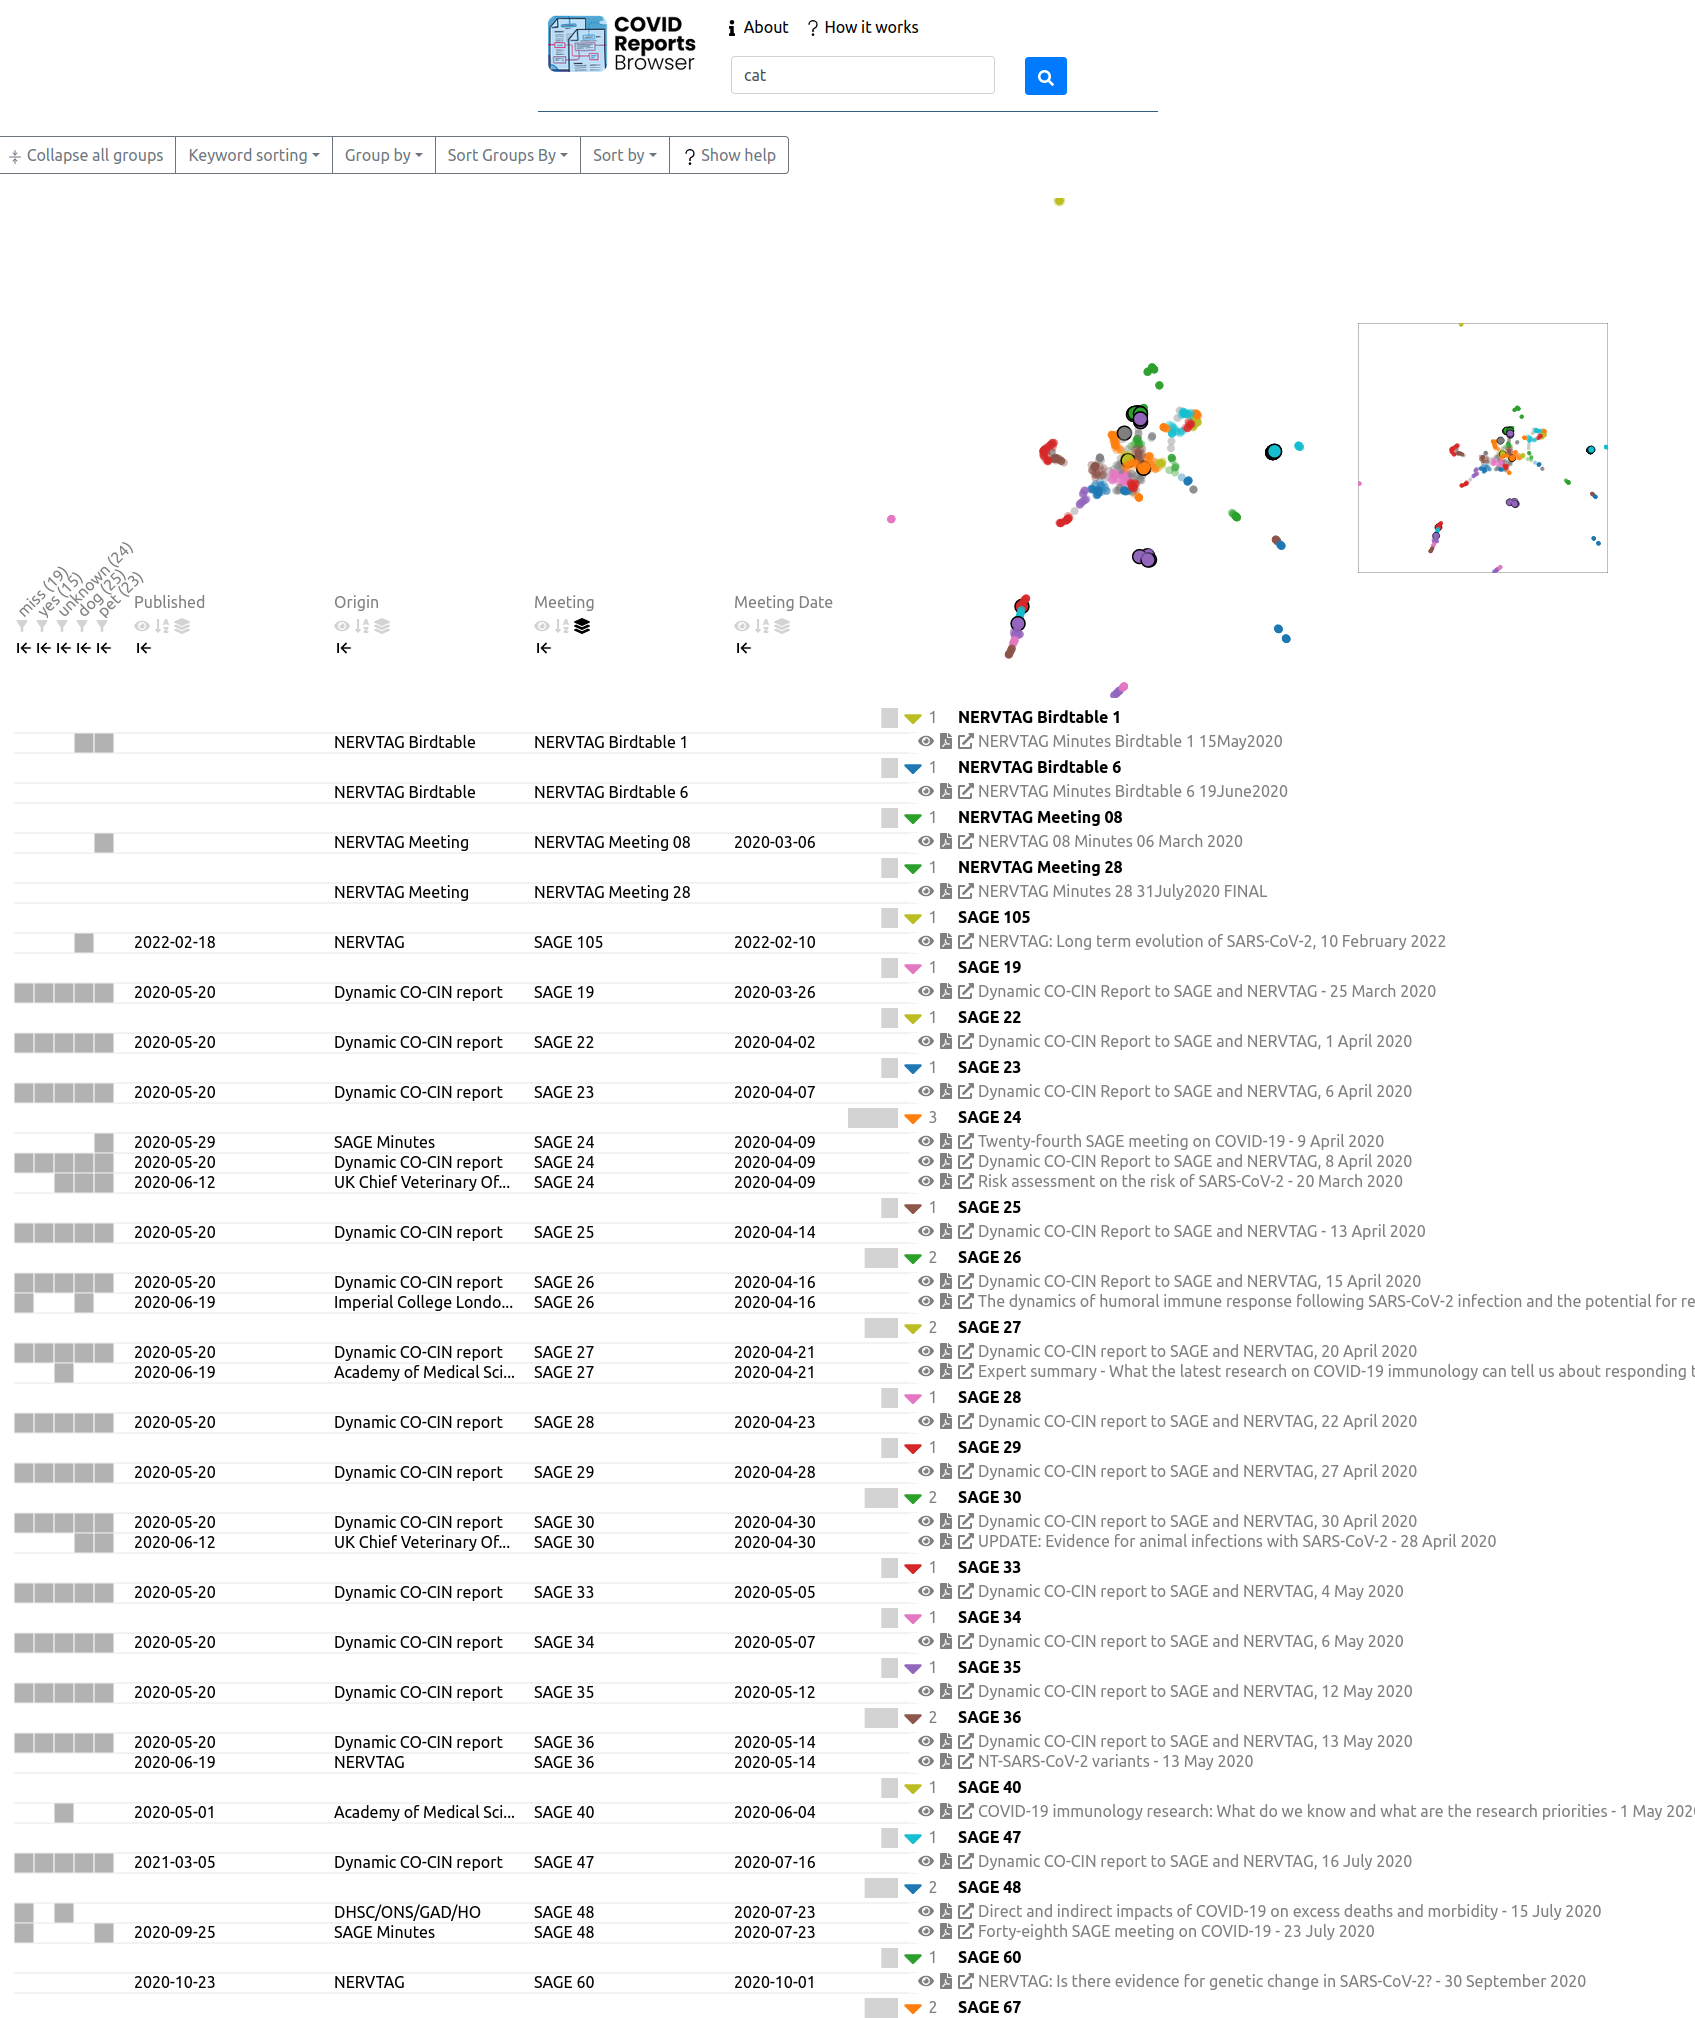
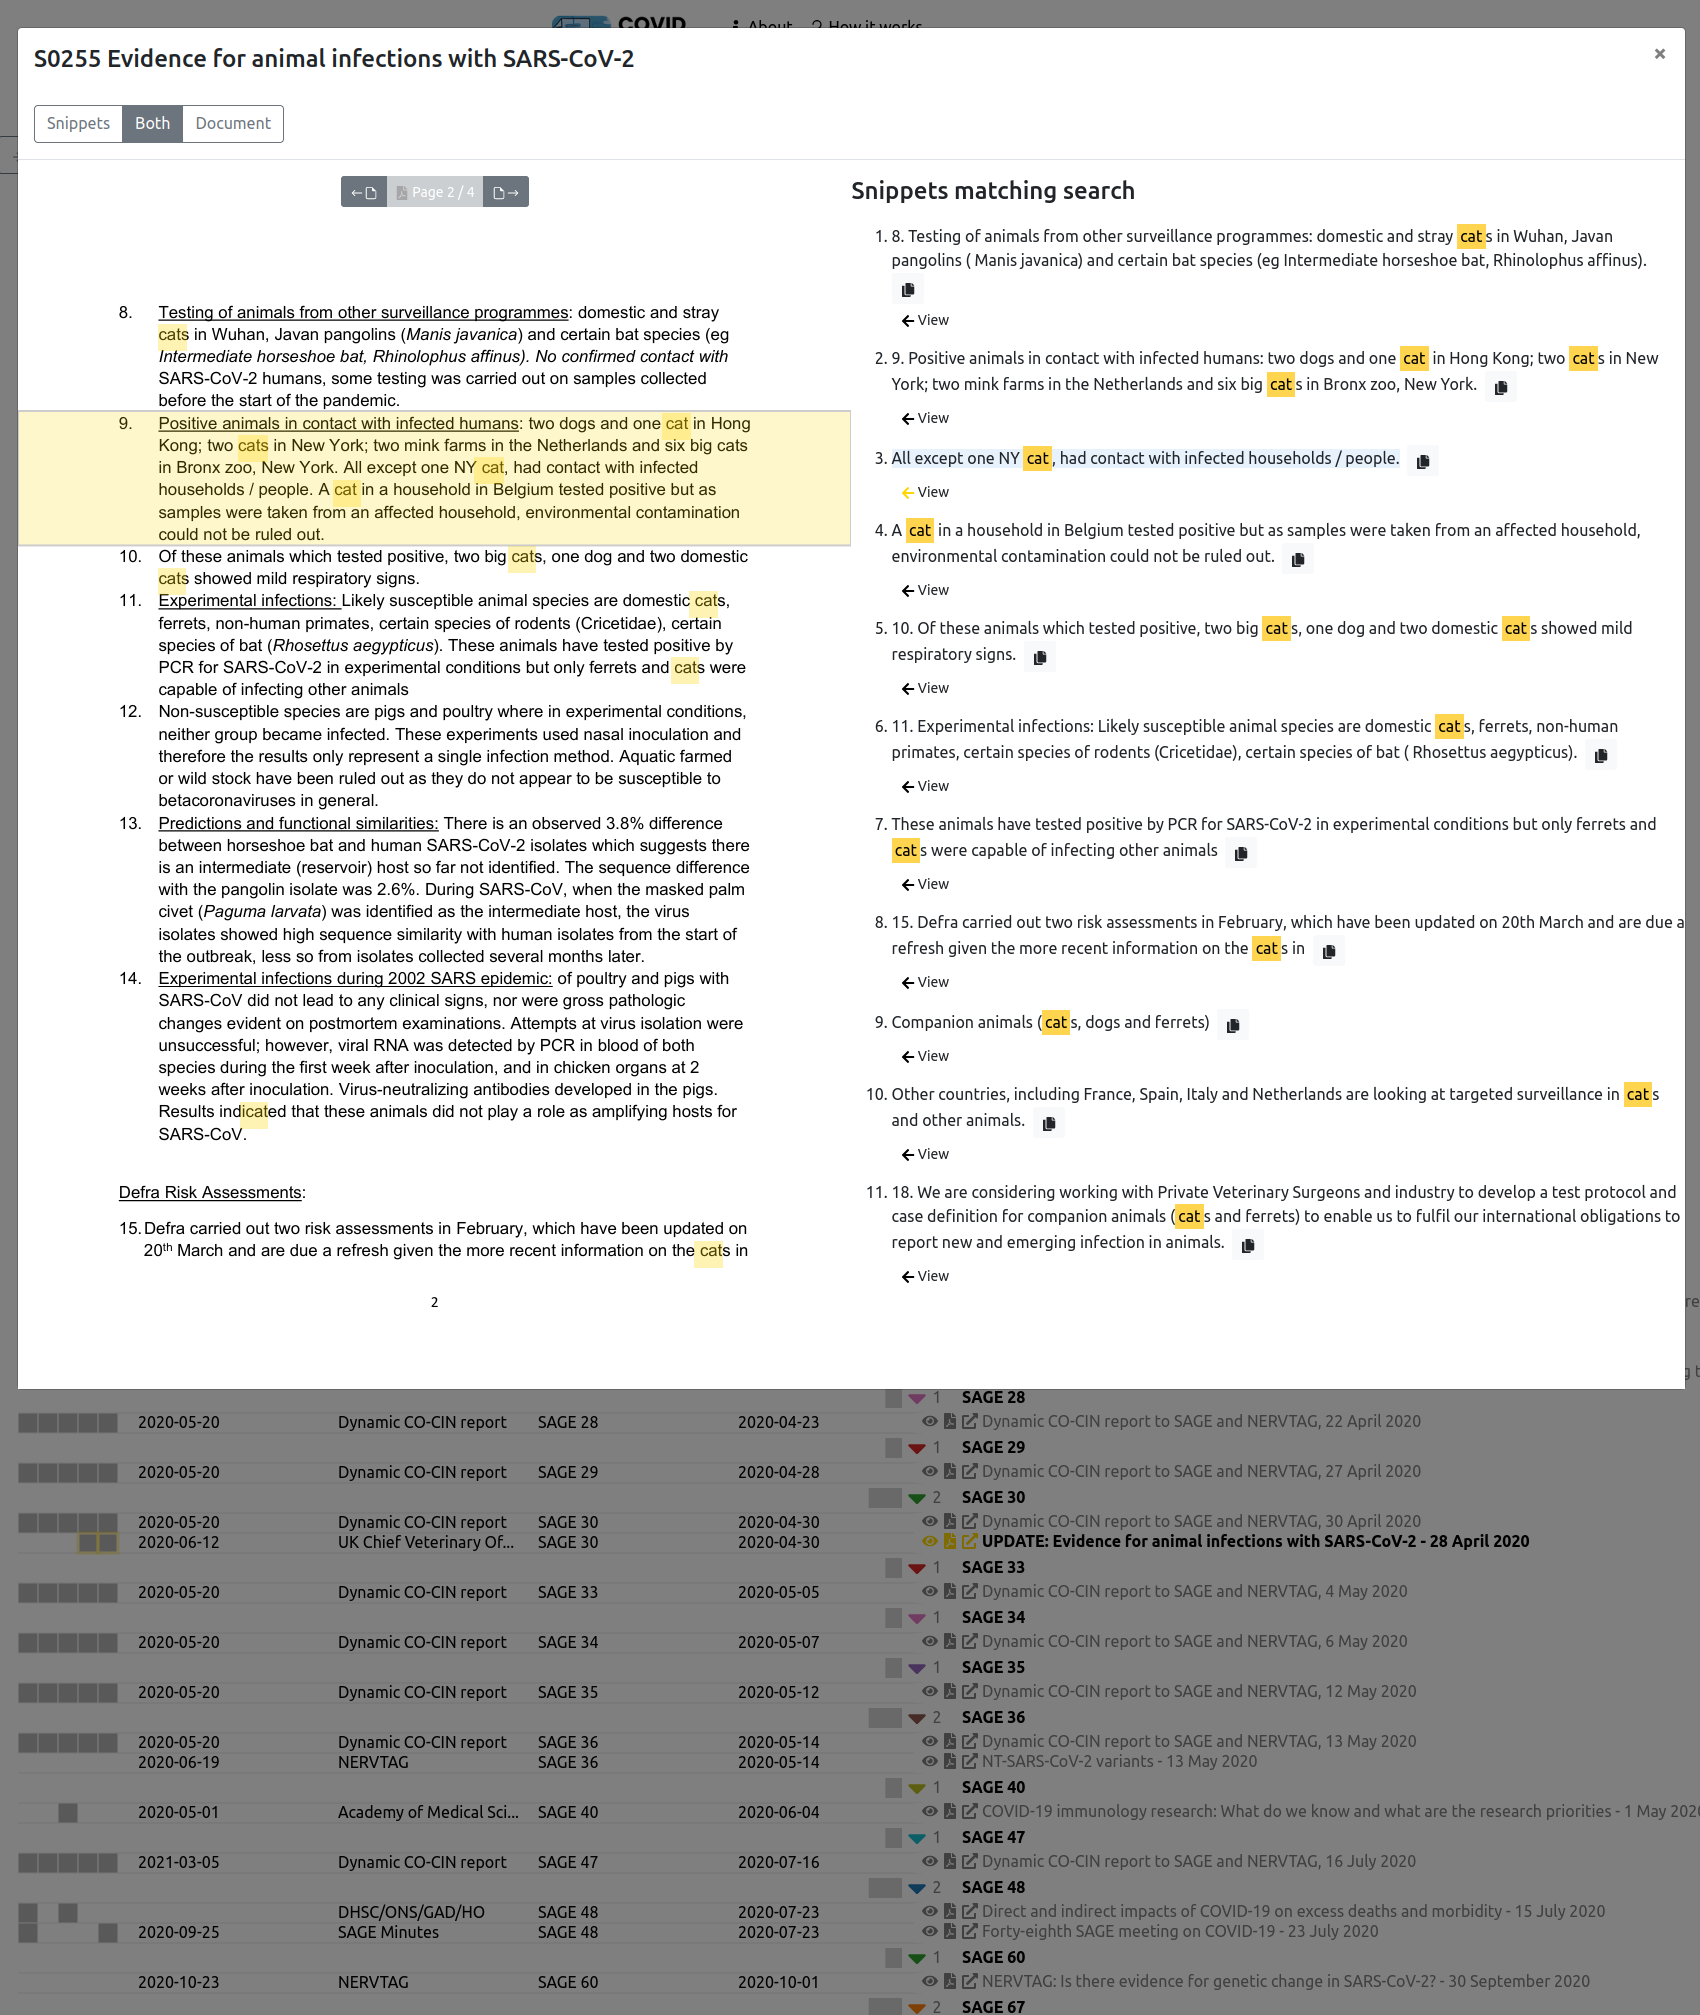
Motivations: I was asked to create a site to help senior clinicians browse collections of clinical guidelines, in order to find high-quality examples to use when writing their own guidelines. Getting doctors to upload documents proved difficult, but the tool was repurposed to enable better browsing and search of the minutes and documents considered at reports of the SAGE and NERVTAG committees.
Intended audience: initially medical consultants; then people working on public health and policy.
Data pre-processing: Colleagues created a pipline to process PDFs, add the full-text to Solr for search, and add metadata to a PostgreSQL database; we jointly wrote a Python application using Flask that exposed an API.
Libraries used: d3.js, React, and the react-pdf component for rendering PDFs
Metadata about COVID research
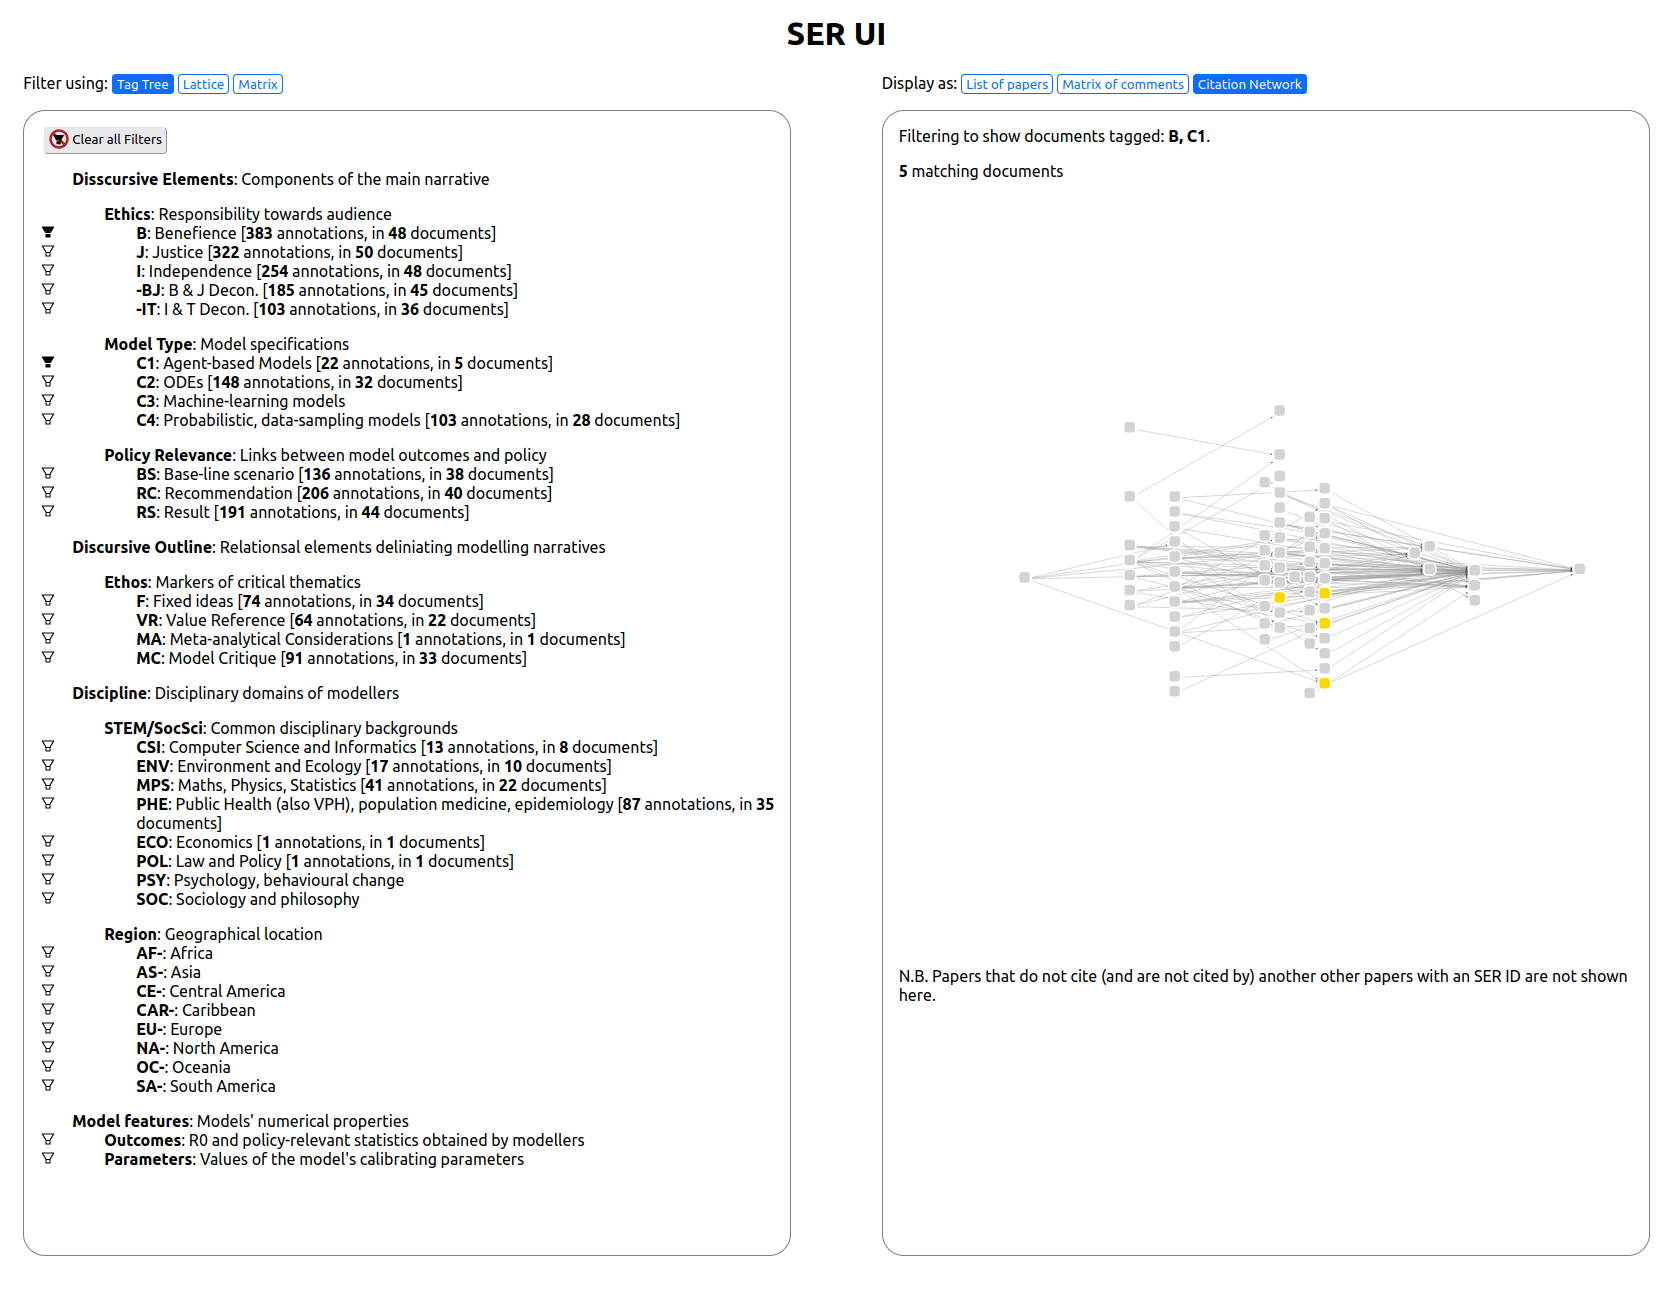
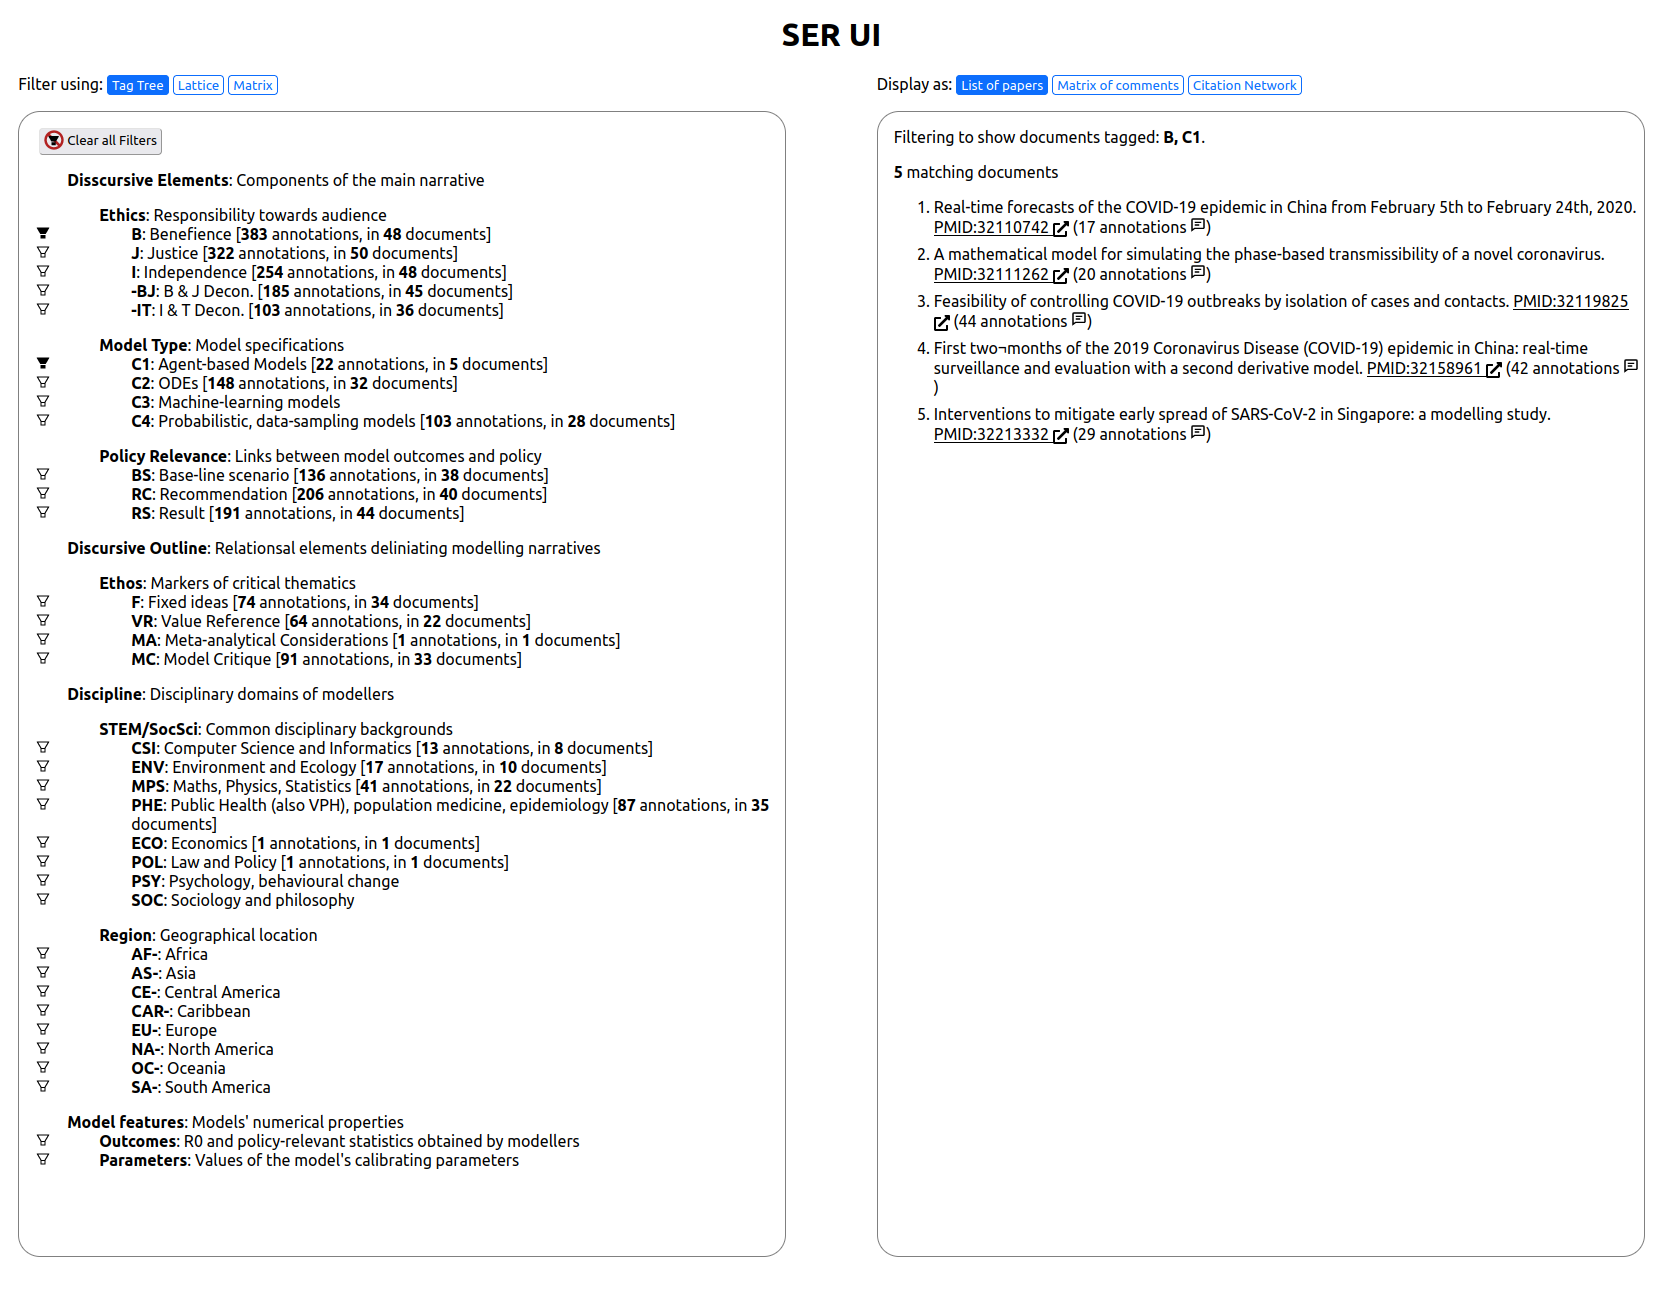
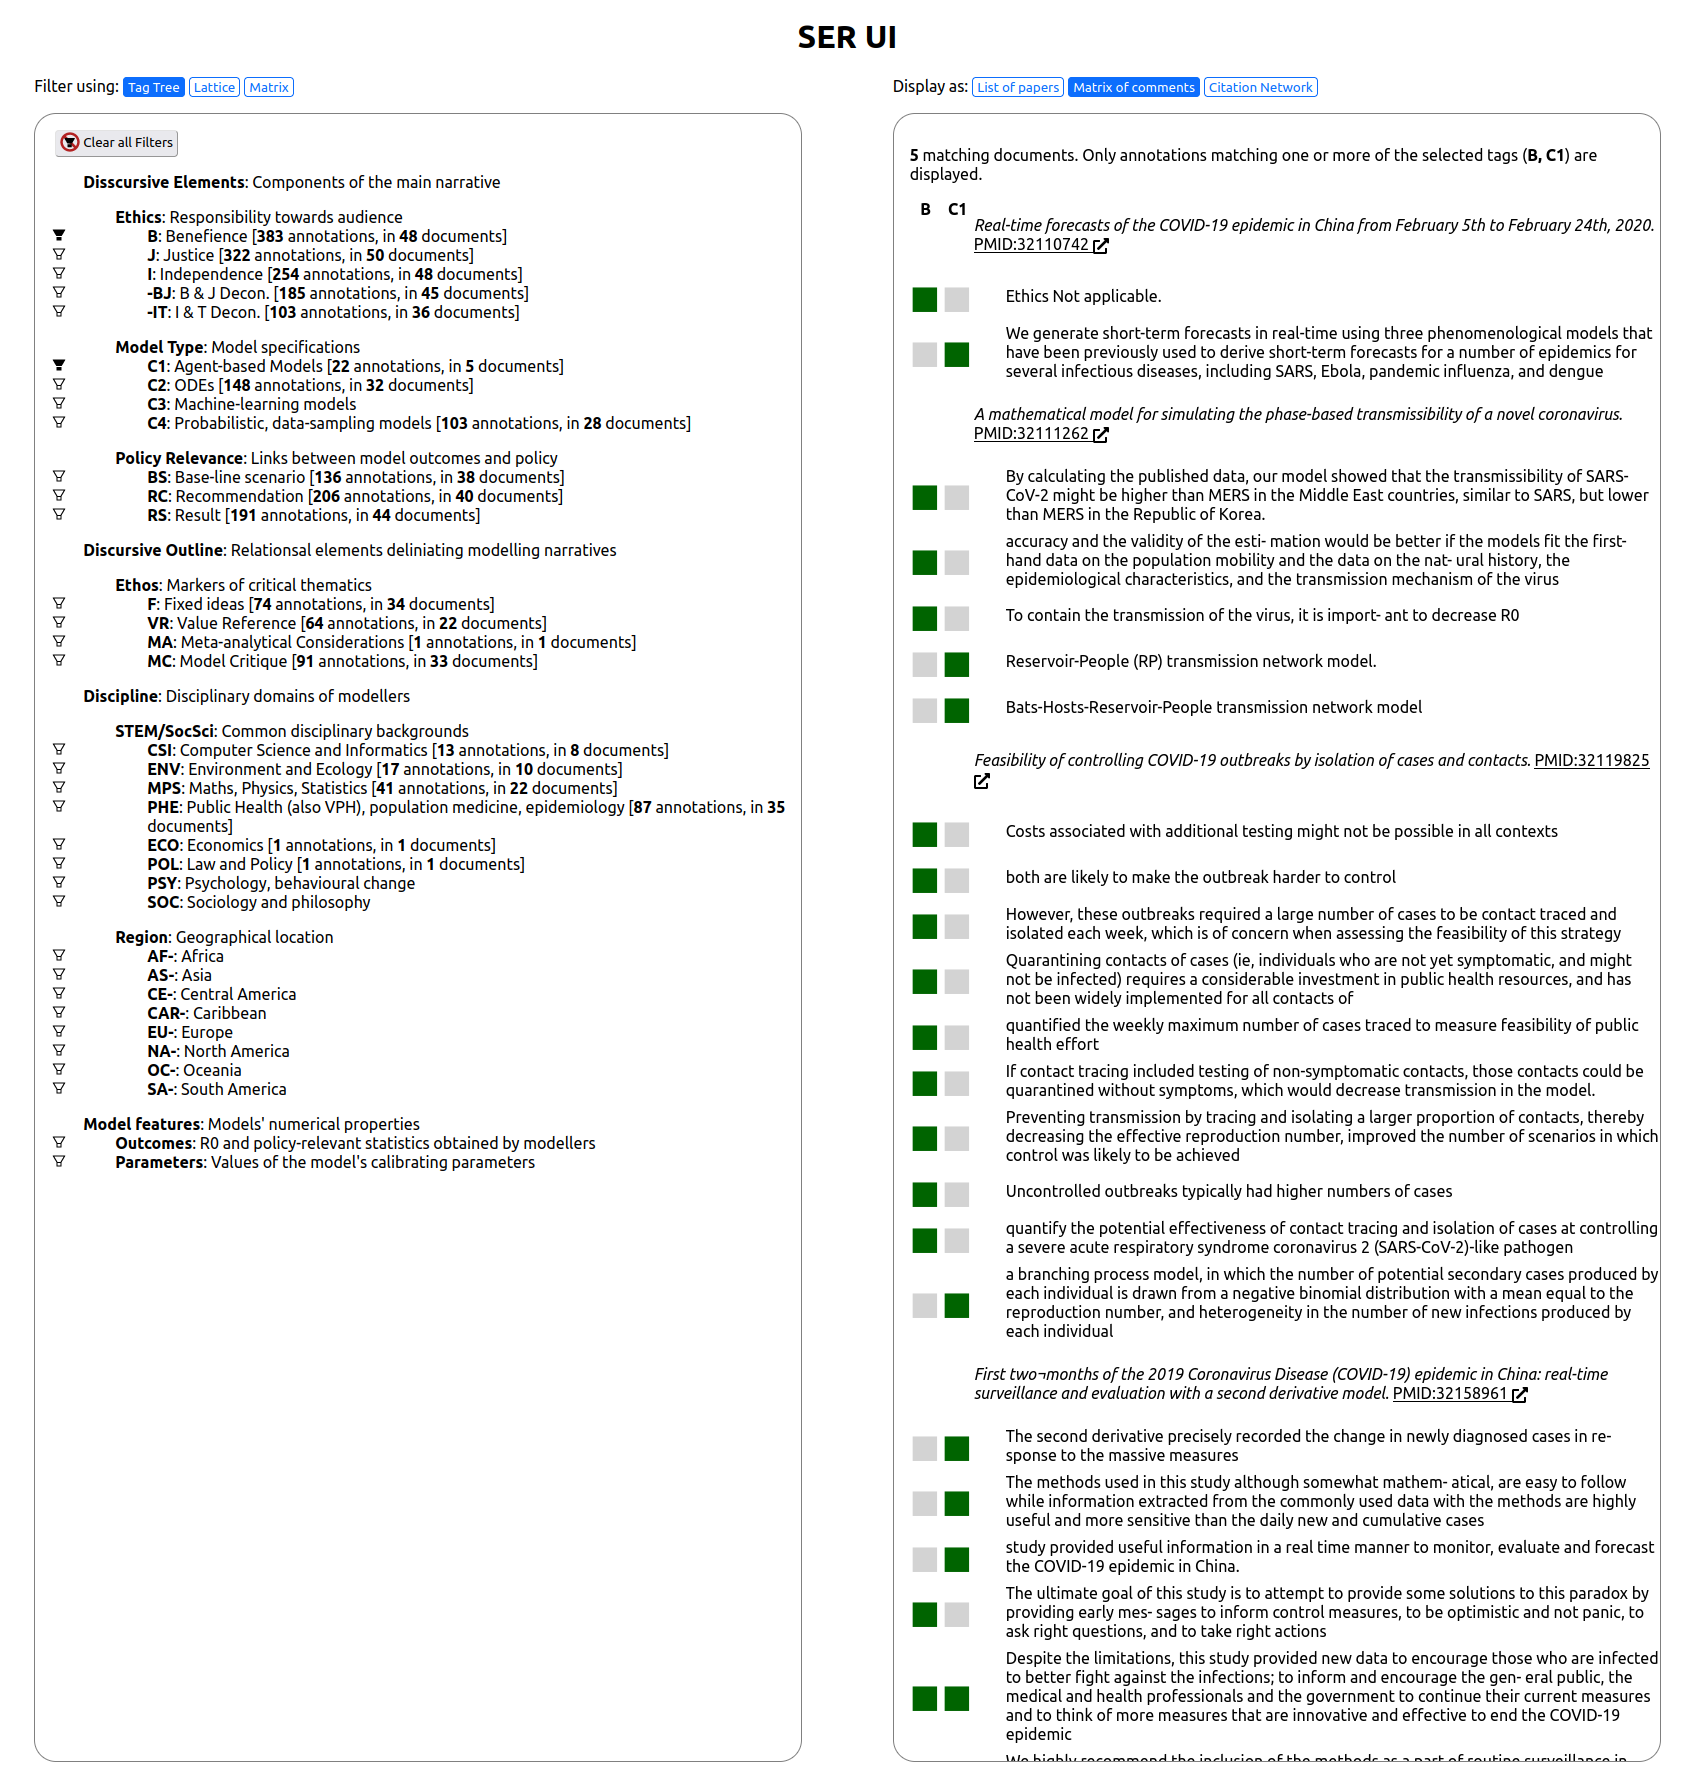
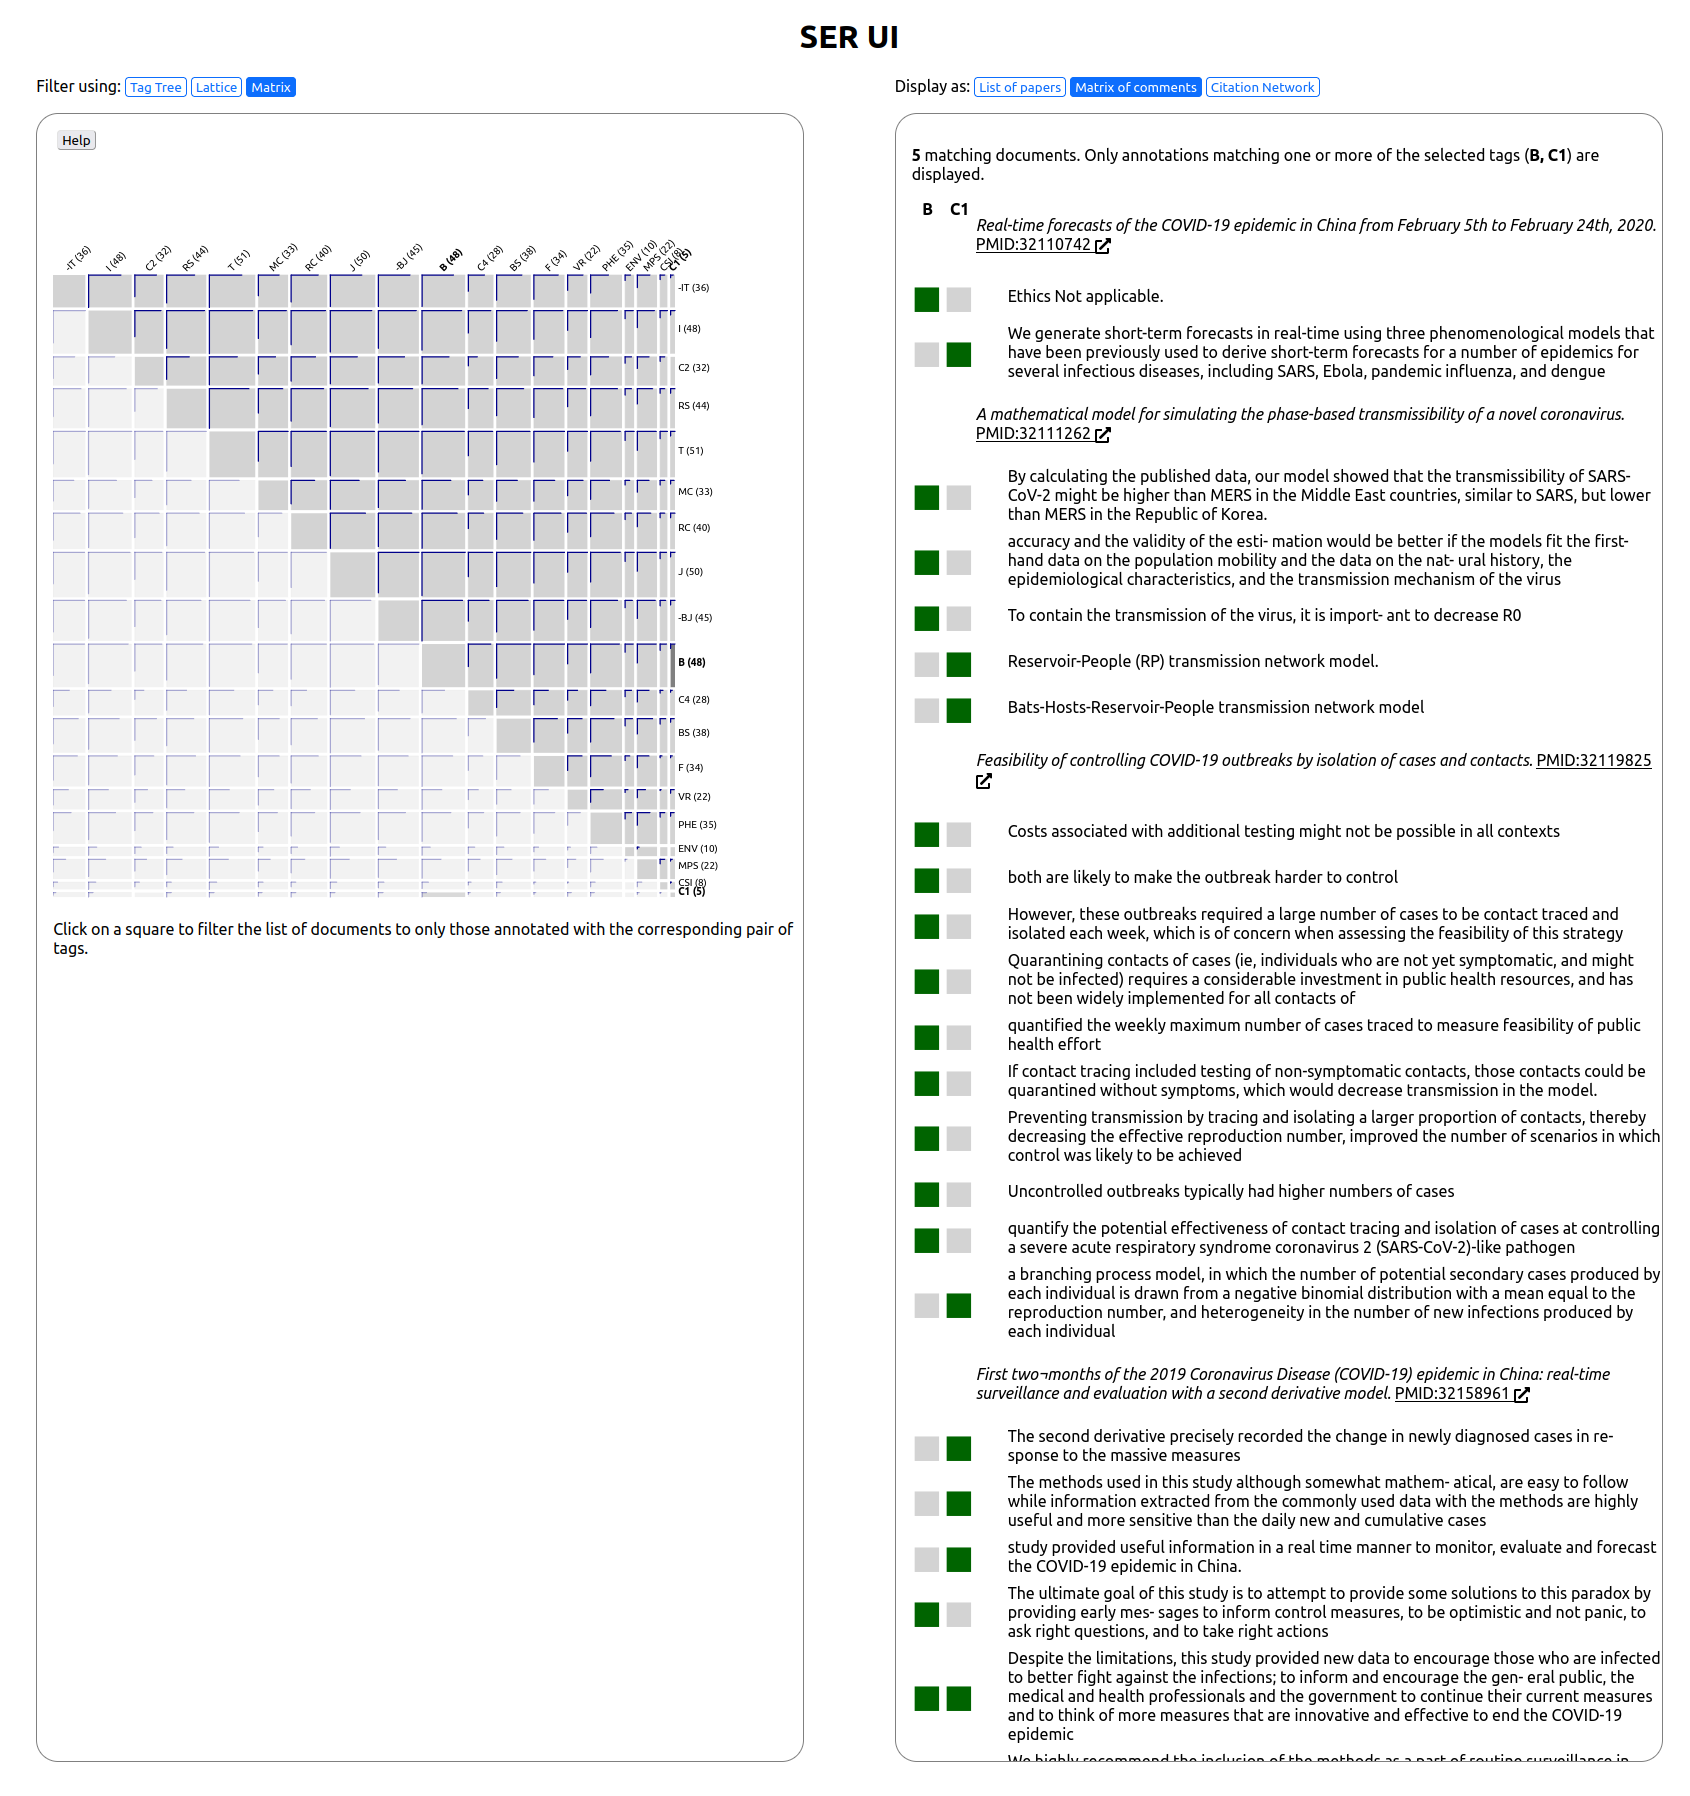
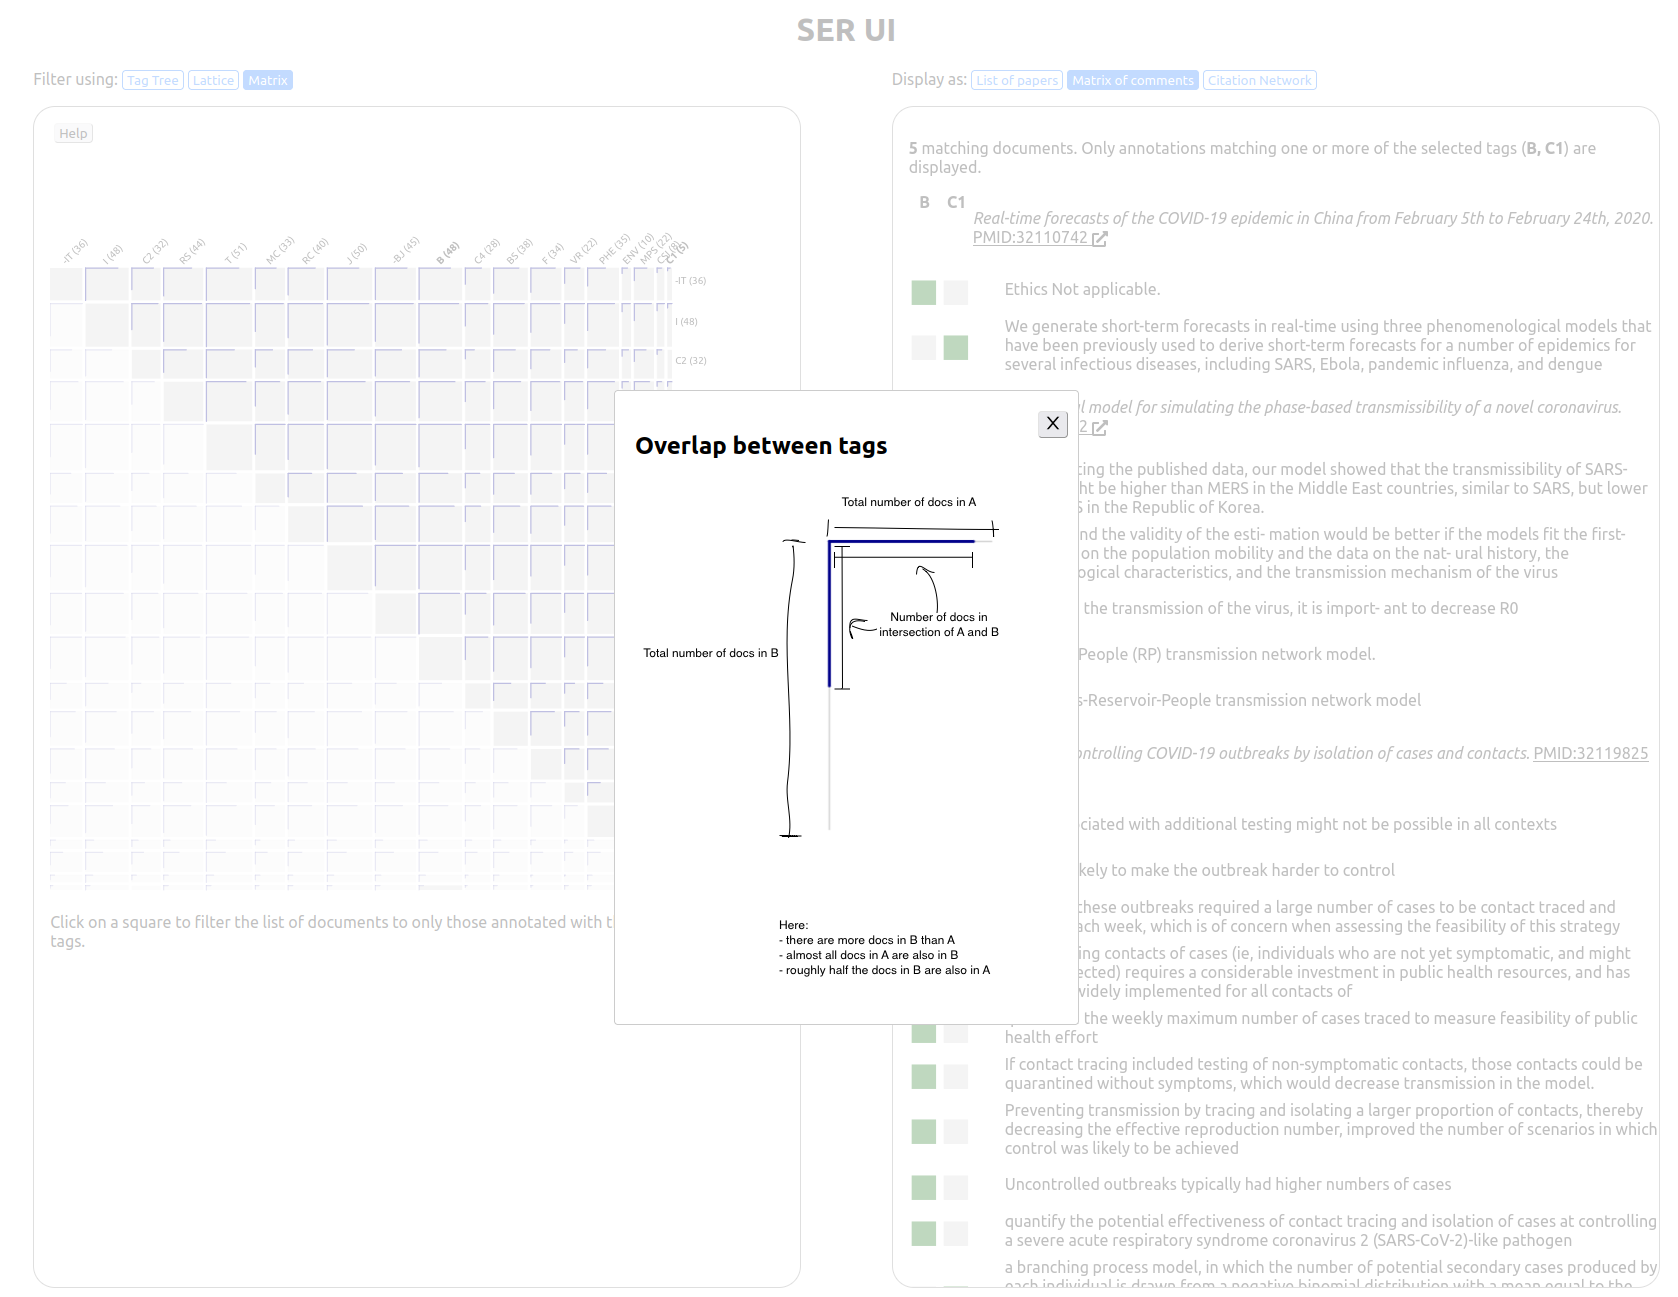
Motivation: Researchers had manually annotated papers with tags (for example, to represent the type of model being used, or which non-pharmaceutical intervention was being considered). This was intended to allow them to answer questions such as whether particular research questions or approaches were localised to particular cliques of collaborators, or were more diffuse. My role was primarily to create a web app that would visually display the tags and bibliographic data associated with the papers, enabling them to view the results of their coding and look for patterns.
Intended audience: initially, the researchers who had tagged the papers.
Data pre-processing: I wrote Python scripts to read the files containing annotations, fetch additional data from the PubMed API, and ingest it into a Neo4j graph database.
Personal Projects
Henley Royal Regatta results (Github, live site)

Motivation: This was a personal project to provide a summary of results for the Henley Royal Regatta that tried to provide a better overview of the relative performance of different crews.
Intended audience: friends from university and other interested in the results of rowing races.
Data pre-processing: a Python script scrapes results from the official website, and writes a JSON file. Initially this used BeautifulSoup for HTML parsing, but after the website was redesigned I was able to load JSON from an API instead.
Libraries used: D3.js.
AI progress viewer (Github, live site)

Motivation: The EFF created a Jupyter notebook summarising progress on AI benchmarks. I found the notebook presentation difficult to browse, so created an alternative visualization in 2017. This was an enjoyable exercise, but the dataset stopped being updated and was made redundant by the Papers With Code project.
Intended audience: a technical audience interested in AI/ML.
Data pre-processing: None - the EFF had already made the data available in a useful JSON format.
Libraries used: D3.js.
Photo Browser
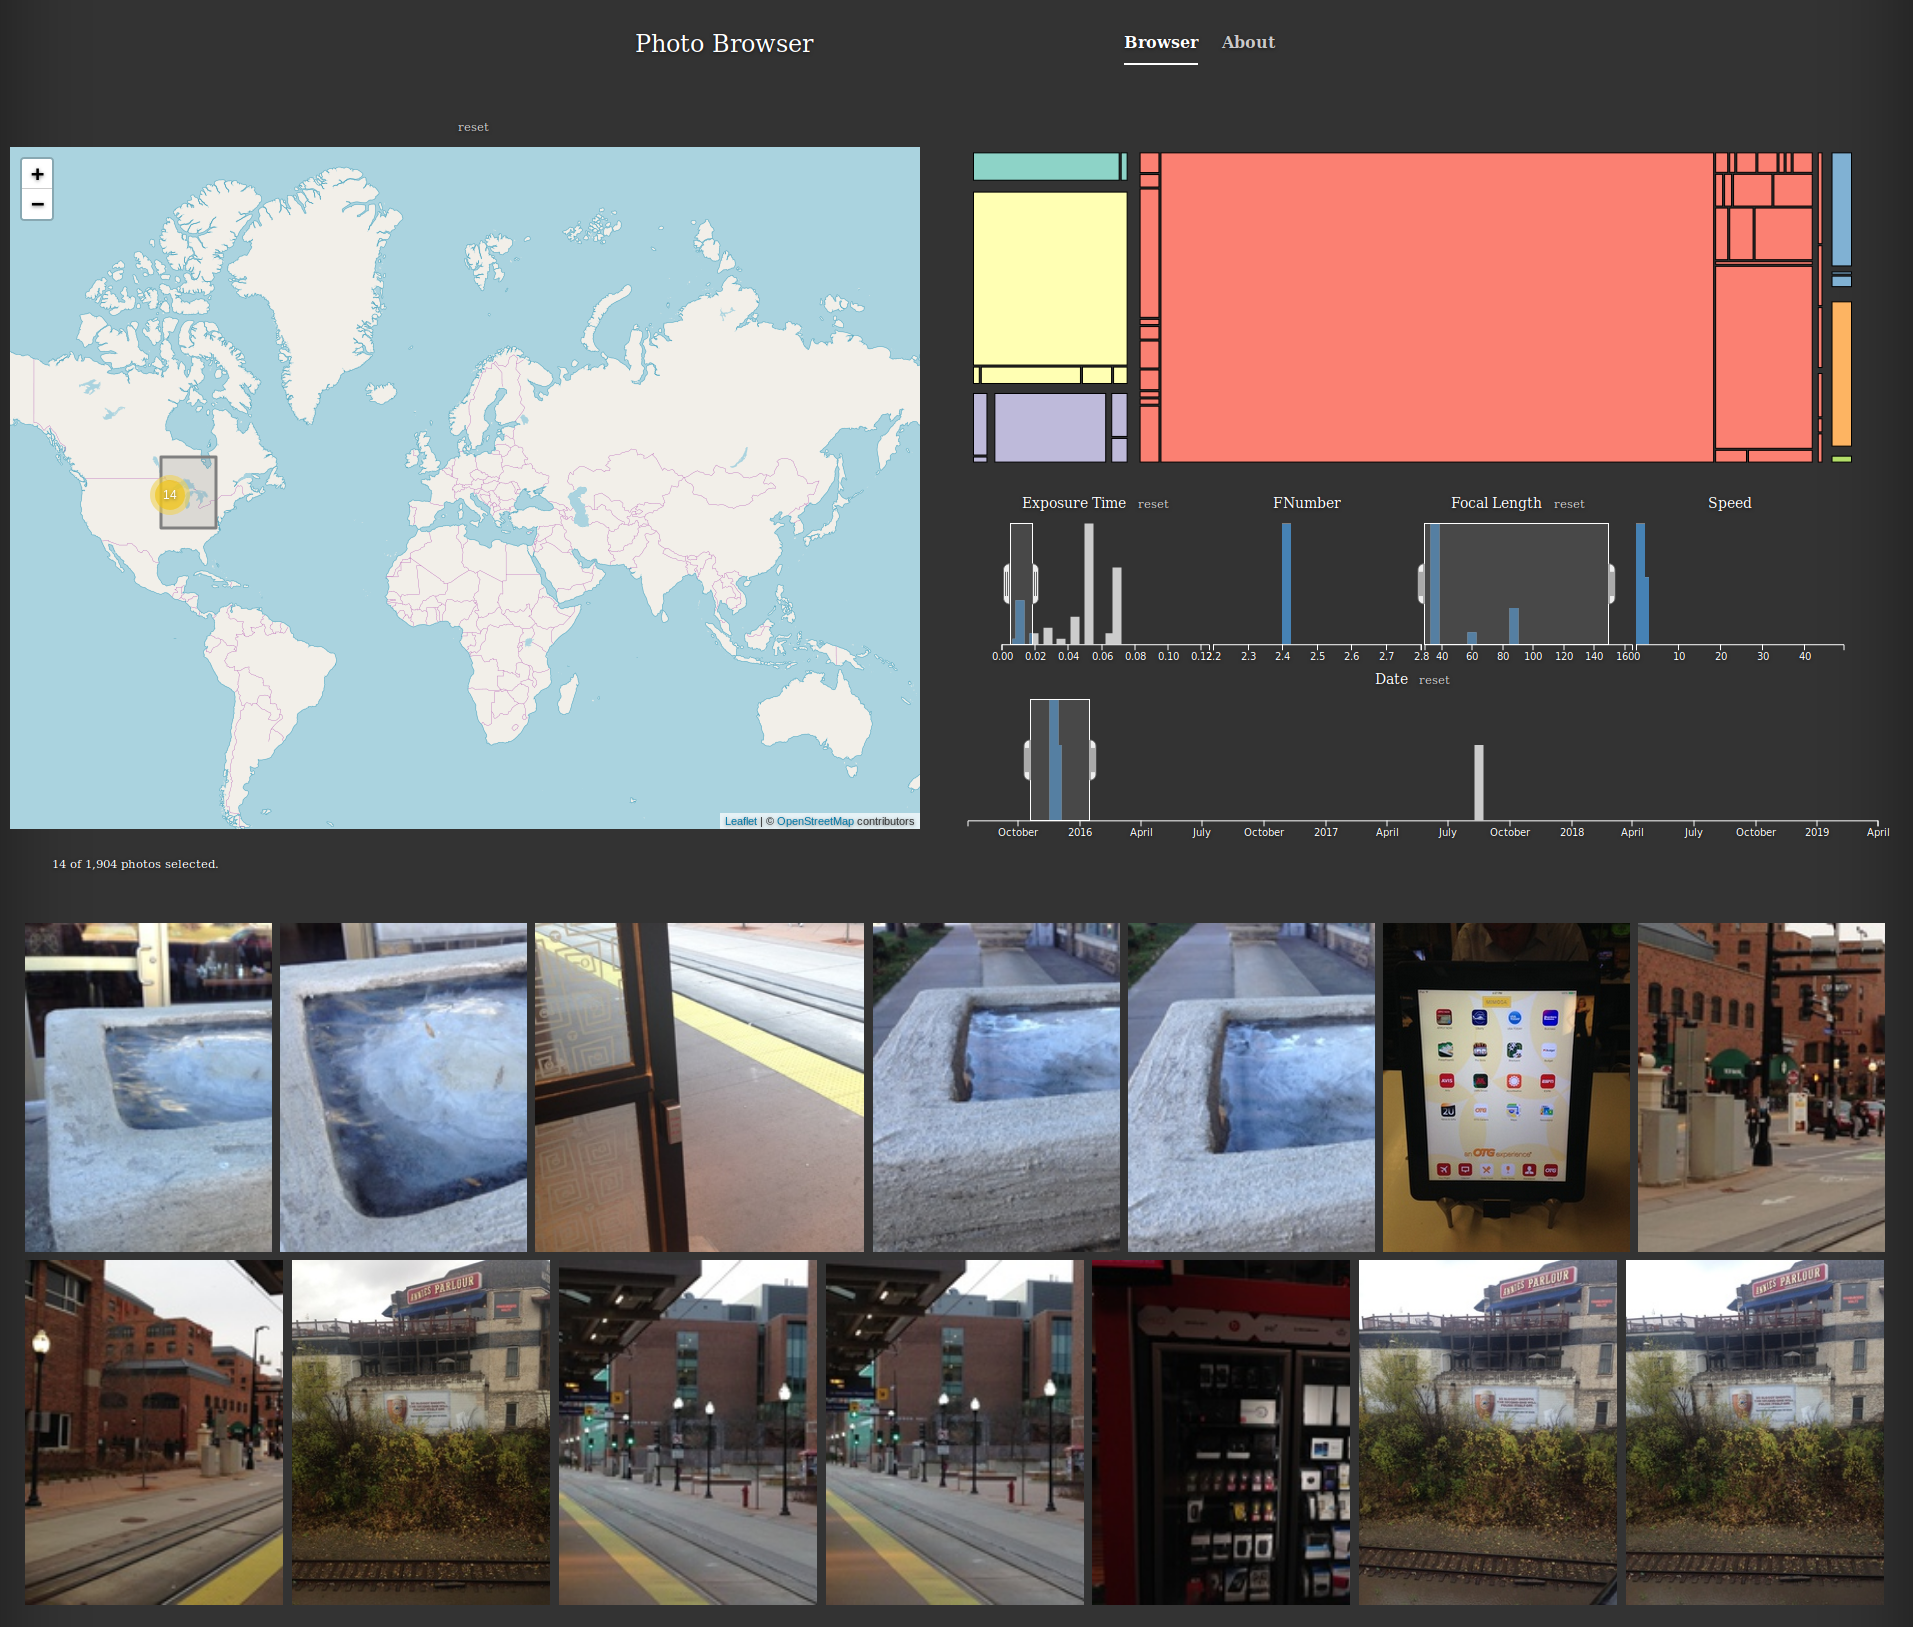
Motivation: Most existing photo-management software lets you filter photos based on attributes like location and date taken, but often only using a single attribute at a time. However, I was unsatisfied with the interactions these provided, and wanted an interface that was more of a coordinated/cross-linked view. This would allow interactions such as:
- viewing a histogram of the dates photos were taken, filtering using a rectangular brush selection, and watching the markers on the map update as the brush was dragged to scrub through time.
- making joint queries like selecting a time range (e.g., corresponding to a trip to Iceland), and also filtering by exposure time (e.g., to select only the long-exposure shots of the Northern Lights).
- selecting a region on a map, and viewing all the corresponding images in that region, rather than being limited to selecting the set of photos corresponding to an aggregated marker.
Intended audience: this was a prototype for my own use.
Data pre-processing: A Python script reads a directory of photos, and produces a directory of thumbnails and a JSON index files containing data extracted from the EXIF metadata.
Libraries used: pig.js to display a grid of images, Leaflet.js to display the map, d3.js and crossfilter.js for the charts
If I find more time to work on this in the future, I'd try to integrate a view like this into an existing open-source photo-management system like PhotoPrism.